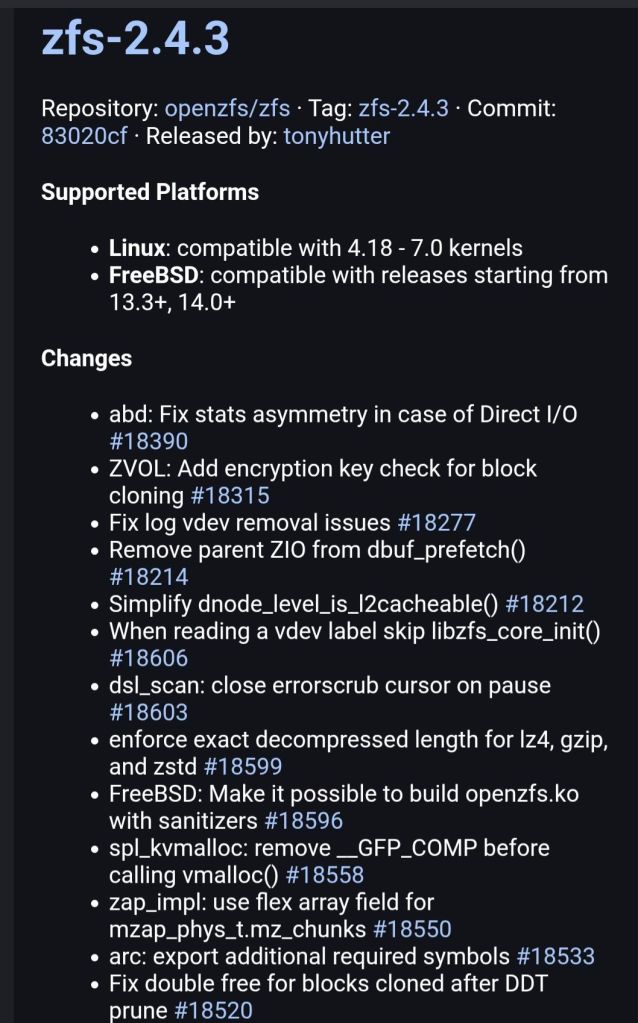
“OpenZFS 2.4.3 is out today as the newest stable point release to this open-source ZFS file-system implementation as well as point releases for the OpenZFS 2.3 and 2.2 series too.
One month after OpenZFS 2.4.2, OpenZFS 2.4.3 is now available with additional fixes. On the Linux side the kernel support still extends up through the Linux 7.0 stable kernel even with Linux v7.1 expected for release this coming Sunday. Hopefully another OpenZFS point release will be out shortly thereafter with blessed Linux 7.1 kernel support.
OpenZFS 2.4.3 adds an encryption key check for block cloning in ZVOL, some FreeBSD-specific work like being able to build the kernel module with sanitizers, fixing some double free conditions, fixing a possible panic, some Linux compatibility updates, a number of continuous integration (CI) updates, and various other minor fixes throughout.
Details on the OpenZFS 2.4.3 changes in full and downloads via GitHub.
In addition to the OpenZFS 2.4.3 point release, OpenZFS 2.3.8 and OpenZFS 2.2.10 are available with many of the same bug fixes back-ported to those prior series plus other relevant fixes.”
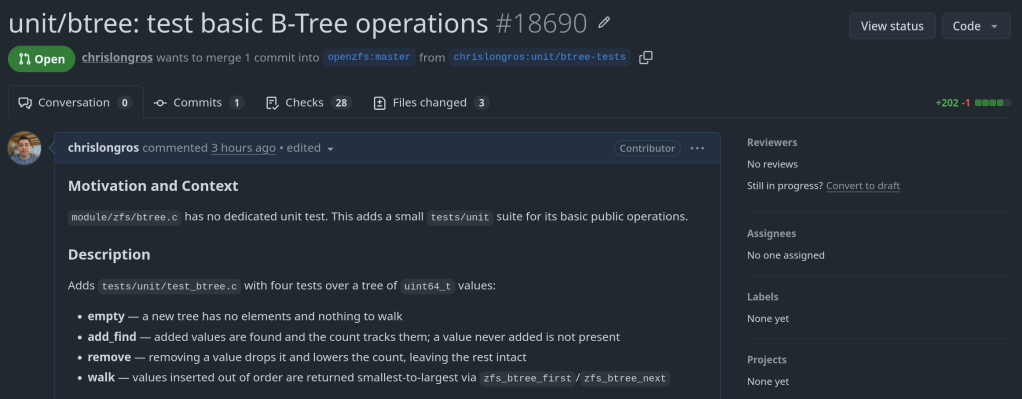
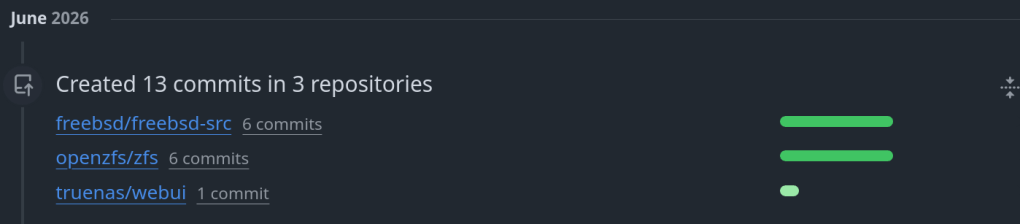
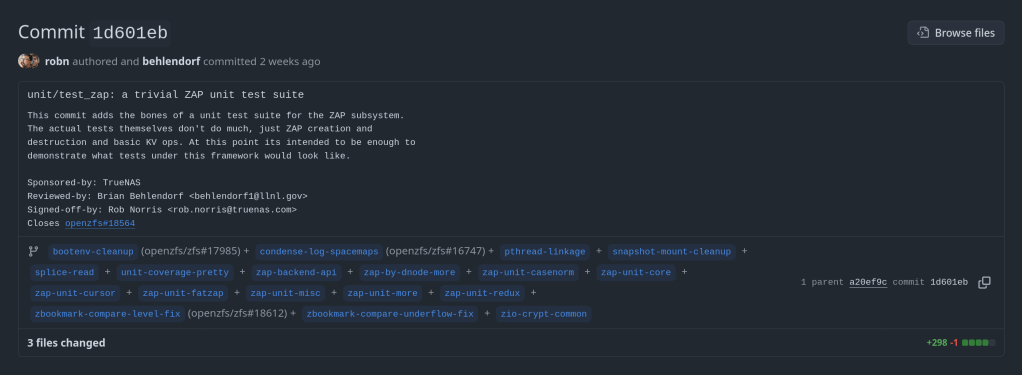
Unit tests are deterministic tests that complement the ZTS testing infrastructure. They were first implemented by robn in test_zap.c to cover the ZAP API including microzap and fatzap.
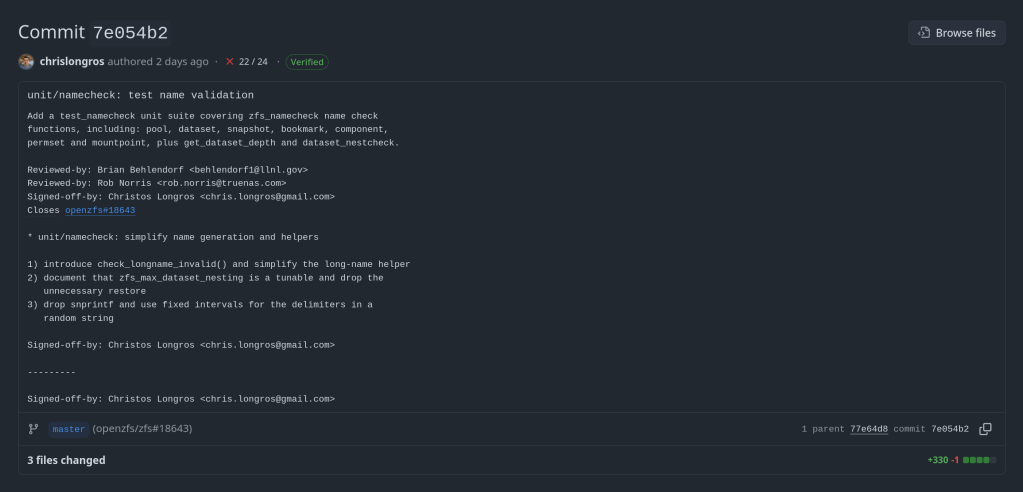
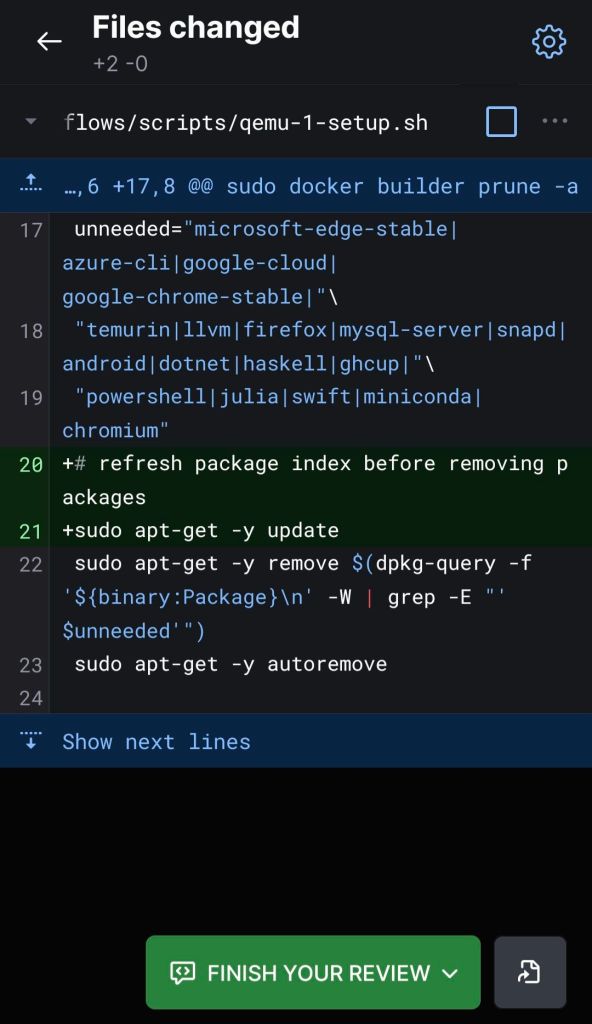
My commit introduces a new namecheck validity testing framework for zfs pools, datasets, snapshots etc. It covers the full namecheck.c functions.
To run the test, execute make unit T=namecheck
> make unit T=namecheck
UNITTEST tests/unit/test_namecheck
Running test suite with seed 0x5842ef3e...
namecheck.pool [ OK ] [ 0.00000954 / 0.00000873 CPU ]
namecheck.dataset [ OK ] [ 0.00001064 / 0.00000984 CPU ]
namecheck.snapshot [ OK ] [ 0.00000589 / 0.00000590 CPU ]
namecheck.bookmark [ OK ] [ 0.00000654 / 0.00000605 CPU ]
namecheck.component [ OK ] [ 0.00000508 / 0.00000508 CPU ]
namecheck.permset [ OK ] [ 0.00000608 / 0.00000561 CPU ]
namecheck.mountpoint [ OK ] [ 0.00000337 / 0.00000329 CPU ]
namecheck.depth [ OK ] [ 0.00000204 / 0.00000159 CPU ]
8 of 8 (100%) tests successful, 0 (0%) test skipped.
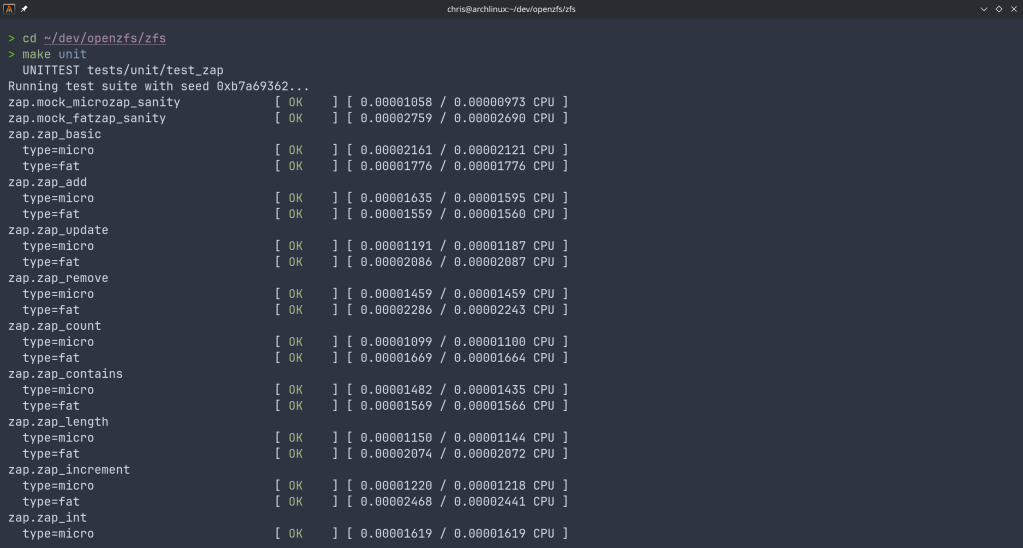
Since then several API functions of ZAP were implemented as unit tests. With my new commit I introduce a uint64 keys test that provides coverage for binary uint64-array keys that are also used by the dedup table (DDT) and the block reference table (BRT).
The test runs dnode operations including: add, lookup, length, lookup_length, update and remove as they are implemented in module/zfs/zap.c
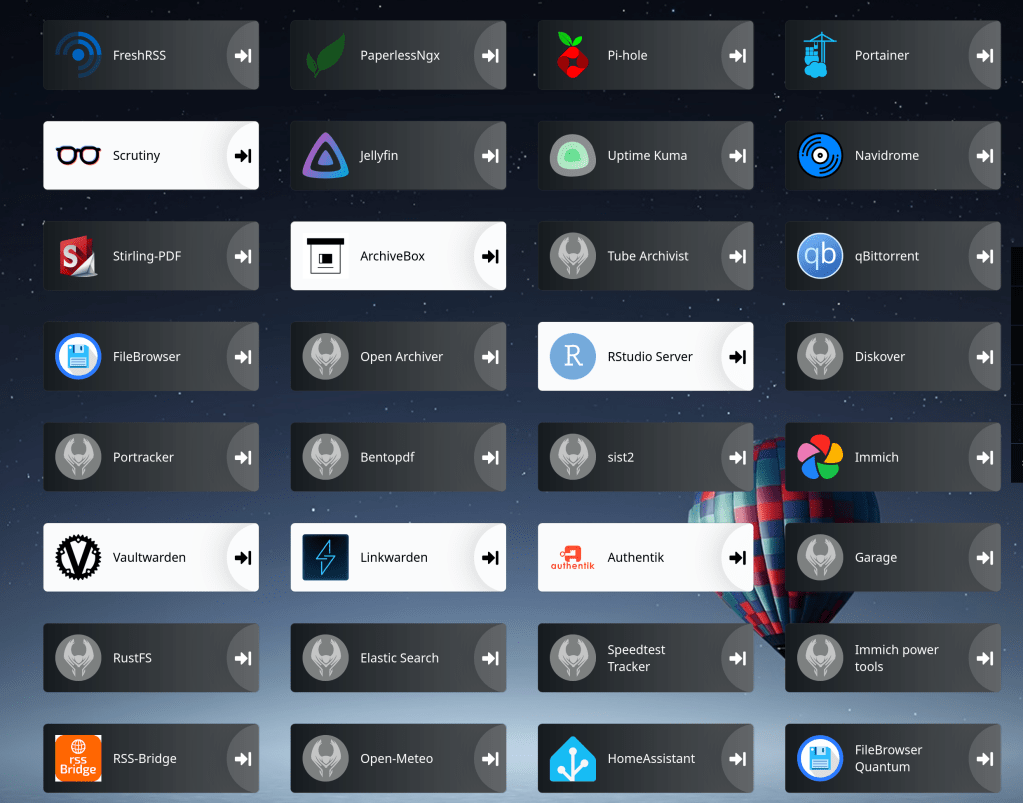
The server runs TrueNAS SCALE (release 26.0.0-BETA.1) on an AMD Ryzen 7 PRO 8845HS, with 32 GiB of memory and no swap configured. Alongside ZFS it hosts a substantial collection of services including Portainer-managed containers, immich, Forgejo, FreshRSS, Jellyfin an automation platform, several PostgreSQL databases, an identity provider, and a number of smaller tools. At the moment of measurement, the operating system reported the following:
            total   used   free   buff/cache   available
Mem:         30Gi   27Gi   1.2Gi      3.8Gi        3.3Gi
Uptime stats:
The following figures come from /proc/spl/kstat/zfs/arcstats, accumulated over an uptime of 53 days:
Metric
Value
ARC size
5.04 GiB
ARC target (c)
5.09 GiB
Maximum (c_max)
29.68 GiB
Minimum (c_min)
0.96 GiB
L2ARC
none configured
The hit and miss rates, derived from the raw counters, break down as follows:
Access class
Hit rate
Miss rate
Overall
96.4%
3.6%
Demand data
98.05%
1.95%
Demand metadata
97.91%
2.09%
Prefetch data
6.0%
94.0%
Prefetch metadata
66.9%
33.1%
Live view of hit/miss performance:
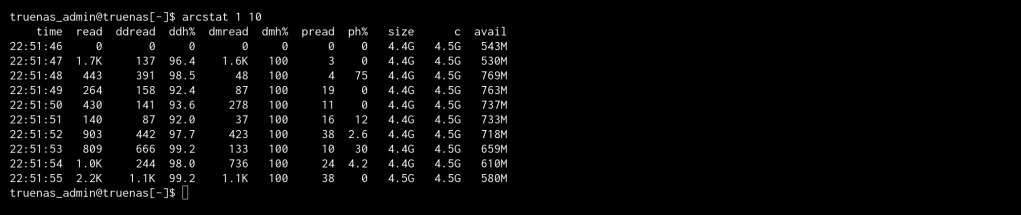
Because the counters above are cumulative since boot, they represent an average spanning nearly two months and cannot, on their own, describe the system’s present behaviour. To capture that, I sampled the cache once per second under active load using arcstat:
With reads peaking at roughly 1500 per second, the demand-data hit rate held steady at approximately 98% matching that of the uptime, thus confirming that the long-term average is not concealing a recent decline in performance. The cache is presently serving requests just as effectively as it has, on average, throughout its uptime.
ddh% : Demand-data hit
dmh% : Demand-metadata hit
Stats were obtained from /proc/spl/kstat/zfs/arcstats, with live sampling via arcstat.
The equivalent figures are available on FreeBSD under kstat.zfs.misc.arcstats.
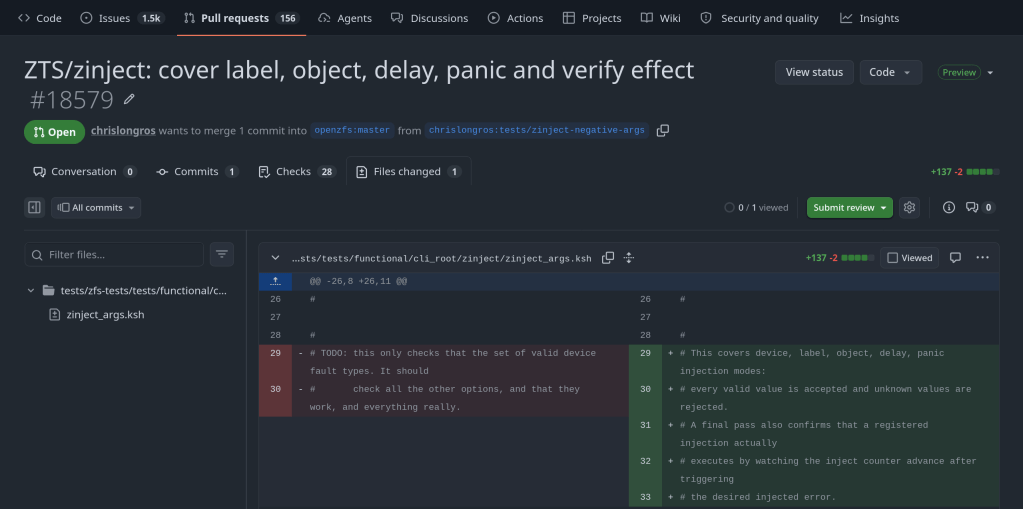
This PR adds test support for label, object, delay and panic error injection modes in the ZTS testing suite. It also contains negative tests verifying the function arguments. A new zinject_counter function is used as a helper to identify if delay, panic error modes are executed in the test.
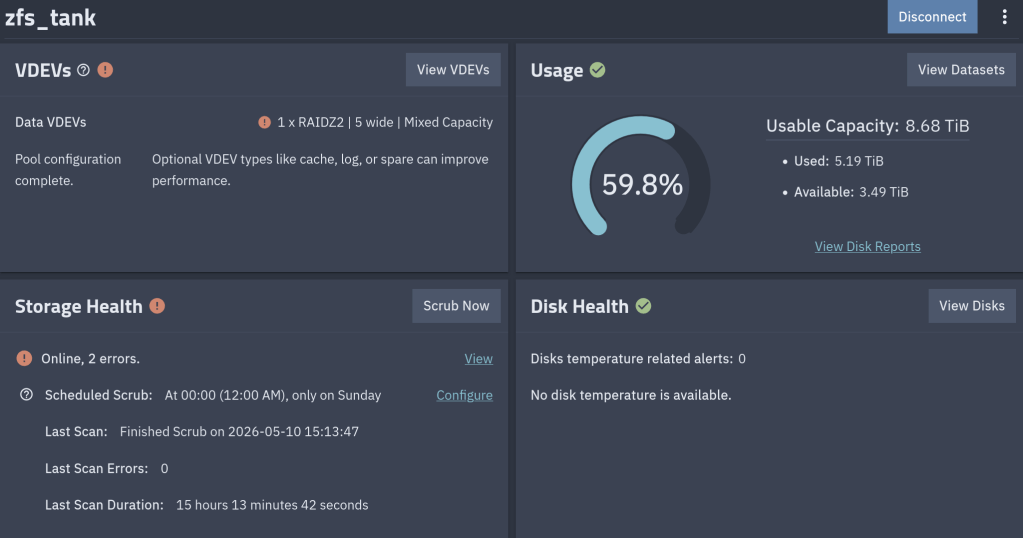
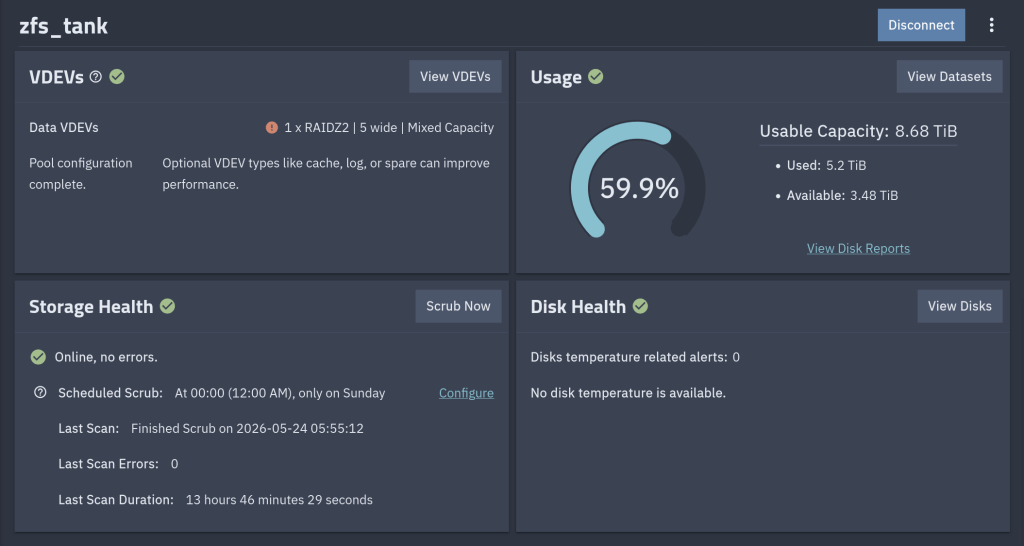
In April I expanded my main pool from four-wide RAIDZ2 to five-wide by adding a single 10 TB Seagate IronWolf to four existing 4 TB WD Red Plus drives. OpenZFS 2.3+ supports RAIDZ expansion: the new column gets added, the existing data keeps its old parity layout until rewritten, and the pool stays online throughout. The expansion completed normally.
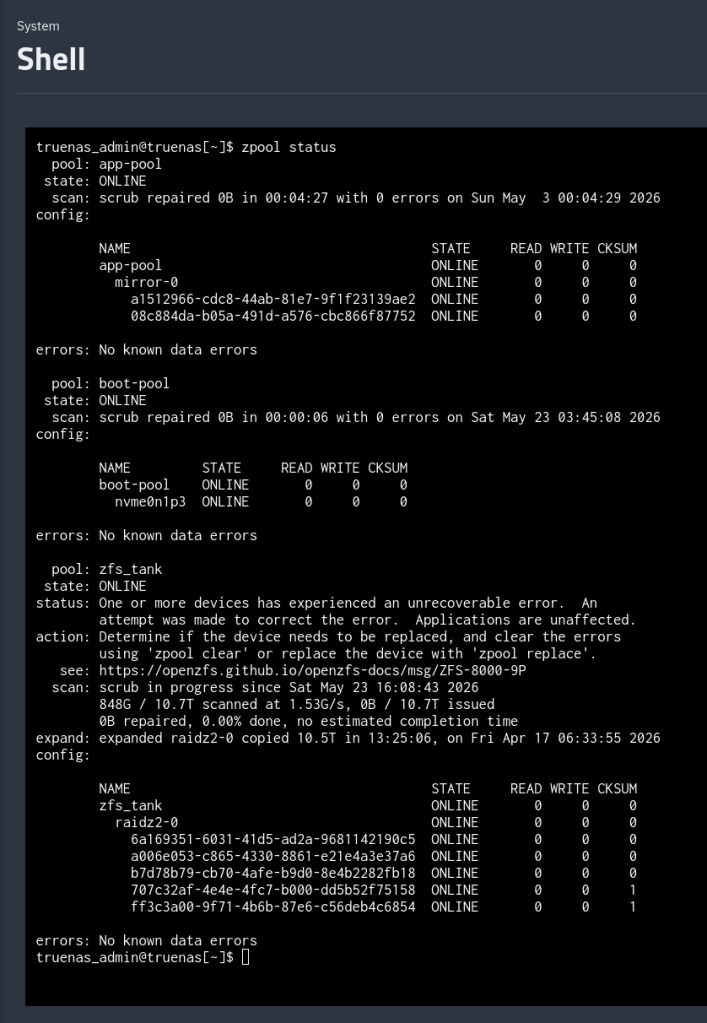
About five weeks later, a scrub showed the following CKSUM error:
$ sudo zpool status zfs_tank
pool: zfs_tank
state: ONLINE
status: One or more devices has experienced an unrecoverable error. An
attempt was made to correct the error. Applications are unaffected.
action: Determine if the device needs to be replaced, and clear the errors
using 'zpool clear' or replace the device with 'zpool replace'.
config:
NAME STATE READ WRITE CKSUM
zfs_tank ONLINE 0 0 0
raidz2-0 ONLINE 0 0 0
6a169351-6031-41d5-ad2a-9681142190c5 ONLINE 0 0 0
a006e053-c865-4330-8861-e21e4a3e37a6 ONLINE 0 0 0
b7d78b79-cb70-4afe-b9d0-8e4b2282fb18 ONLINE 0 0 0
707c32af-4e4e-4fc7-b000-dd5b52f75158 ONLINE 0 0 1
ff3c3a00-9f71-4b6b-87e6-c56deb4c6854 ONLINE 0 0 1
errors: No known data errors
One checksum error on each of two disks. The pool itself reports zero errors: errors: No known data errors. So no data were degraded.
RAIDZ2 carries two parity columns, the scrub detected bad blocks, and ZFS reconstructed them from parity so the pool status remains healthy. But zpool status only tells you that an error happened and not if it got corrected.
So where is the healing actually recorded?
What zpool status shows, and what it doesn’t
The four columns in zpool status map directly to four counters in the kernel’s vdev_stat_t structure (include/sys/vdev_impl.h):
vs_read_errors
vs_write_errors
vs_checksum_errors
the implicit STATE
zpool status parses each leaf vdev’s stats and prints those four numbers. It does not print any of the other ~30 fields in the structure — including this one:
uint64_t vs_self_healed; /* total bytes self-healed */
vs_self_healed is incremented in vdev_stat_update() whenever ZFS issues a write with the ZIO_FLAG_SELF_HEAL flag set, which happens after a successful parity reconstruction. The kernel knows exactly how many bytes were healed on each disk. It just doesn’t tell you via the standard zpool status output.
Three places the heal counter does surface
1. Raw kstats (Linux only)
The OpenZFS Linux module exposes every leaf vdev’s full vdev_stat_t under /proc/spl/kstat/zfs/<pool>/. The filenames use the leaf vdev GUID. Pull those GUIDs out of the pool query:
$ sudo ls /proc/spl/kstat/zfs/zfs_tank/ | head
io
state
txgs
vdev_395717205876781294
vdev_4003307236673040230
vdev_7306733904703790705
vdev_803393823450321549
vdev_9021081546382363770
The 9021... and 4003... files are the two disks with errors. Inside:
self_healed 4096 — four kilobytes. The pool’s ashift is 12, so one block. Exactly one block was reconstructed and rewritten on this disk. Same value on the other affected disk.
2. The TrueNAS middleware API
If you’re on TrueNAS, the same field comes back as JSON from the pool.query endpoint:
{
"name": "707c32af-4e4e-4fc7-b000-dd5b52f75158",
"stats": {
"checksum_errors": 1,
"self_healed": 4096,
"read_errors": 0,
"write_errors": 0
}
}
This is how I first saw the number. The middleware just unpacks vdev_stat_t into JSON.
3. zpool events — the actual heal log
Counters tell you how much. To see when and where, look at the ZFS event ring buffer:
Each event names the affected disk, the byte offset on that disk, the size (here 0x1000 = 4 KiB), the dataset and object, and both checksums. With this you can compute exactly which file (if any) the block belonged to. The buffer holds ~1000 events by default (zfs_zevent_len_max), so old events roll out unless ZED has persisted them to /var/log/zfs/zed.log.
This is the closest thing ZFS has to a “self-heal log.”
What I actually had
Two disks, one block each, both healed. Different manufacturers (WD Red Plus 4 TB / Seagate IronWolf 10 TB), different uptime (6124 h / 3724 h), so a shared hardware fault was unlikely. SMART on both was clean:
Same story on the Seagate. No reallocated sectors, no pending sectors, no UDMA CRC errors.
UDMA_CRC_Error_Count is the SATA-link error counter. If a cable, backplane, or HBA channel is marginal, this is where it shows up. Both at zero rules out the data path between disk and controller.
What it doesn’t rule out is RAM. This system runs 32 GB of non-ECC DDR5. A single bit-flip in a write buffer leaves a permanently-bad block on disk that scrubs will keep detecting and healing on every pass. The block stays wrong because the heal write reads the (correct) reconstructed buffer from the same RAM that may flip again. Without ECC, you can’t fully exclude this; with non-ECC, you also can’t measure it.
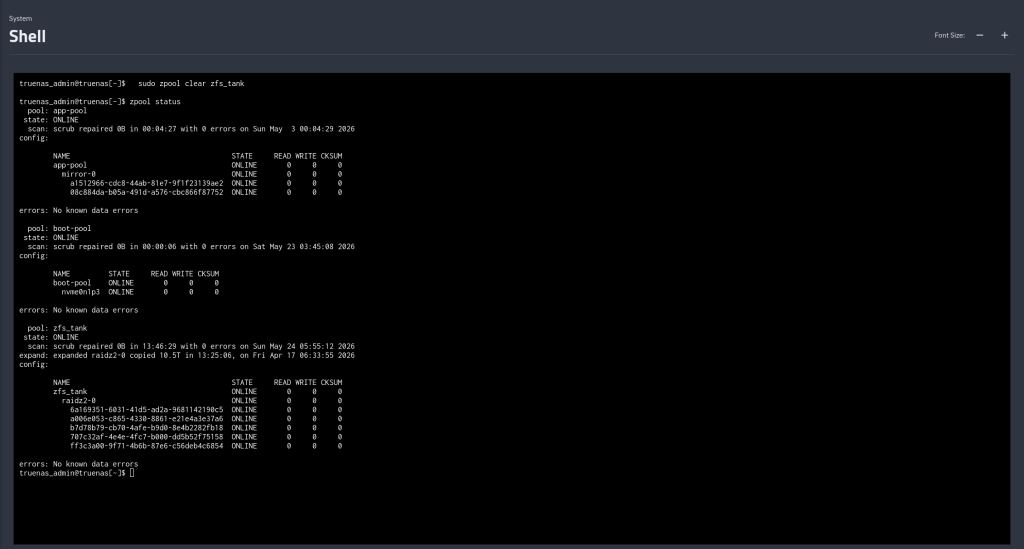
zpool clear vs zpool scrub
The counters in zpool status and vs_self_healed are cumulative since the last zpool clear (or since pool creation). A scrub does not reset them.
So when I ran a scrub after the original event, the 1s in the CKSUM column did not go away — they were the same 1s from before.
$ sudo zpool clear zfs_tank
$ sudo zpool status zfs_tank
pool: zfs_tank
state: ONLINE
config:
NAME STATE READ WRITE CKSUM
zfs_tank ONLINE 0 0 0
...
errors: No known data errors
The status line and the per-disk counters reset together. vs_self_healed resets too. After that, the next scrub starts from zero — if the same blocks show up healed again, you know the corruption is persistent on-disk (and the suspicion shifts toward RAM); if they don’t, the original event was probably a one-shot.