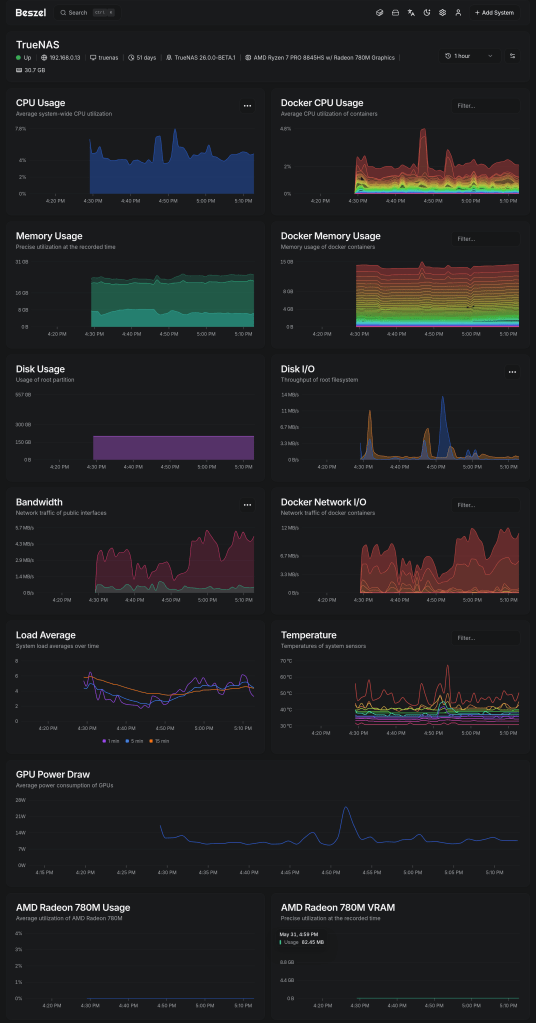





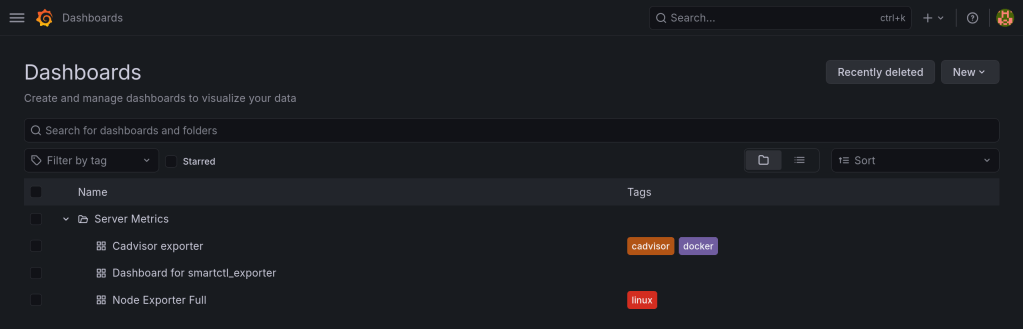
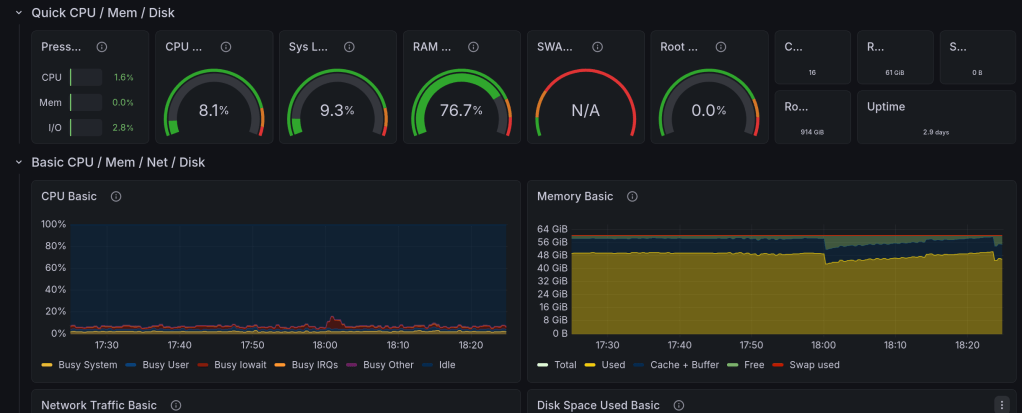
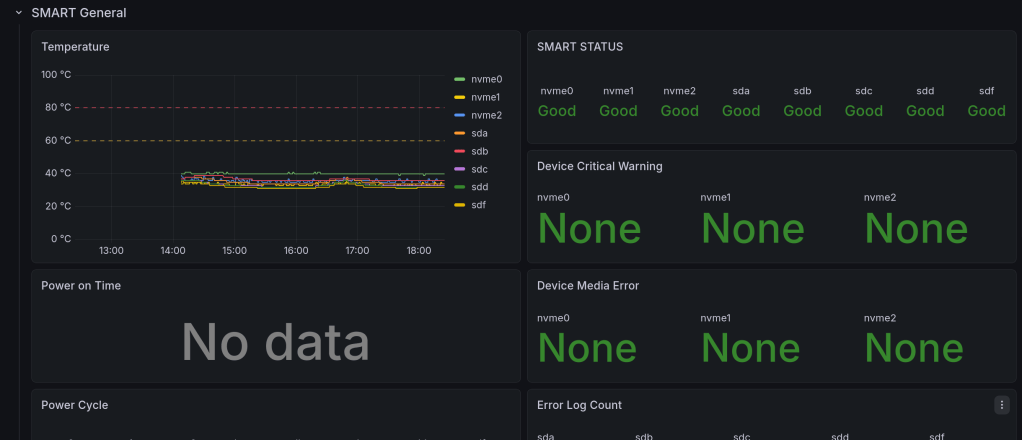
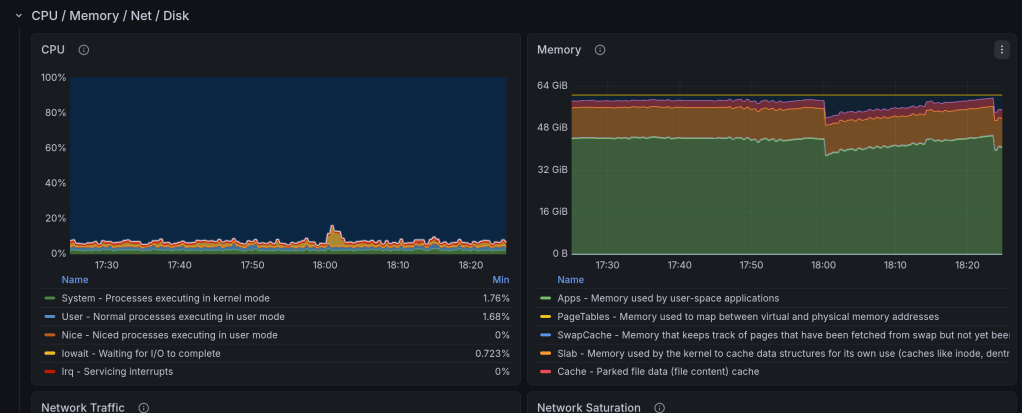
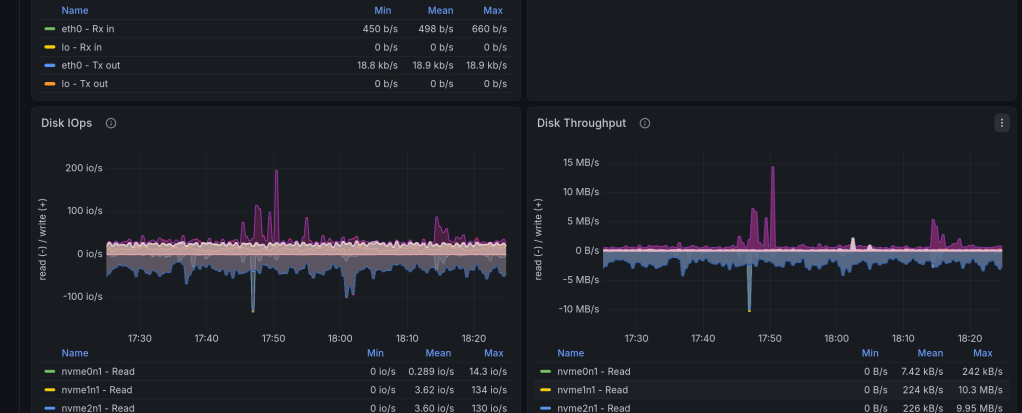
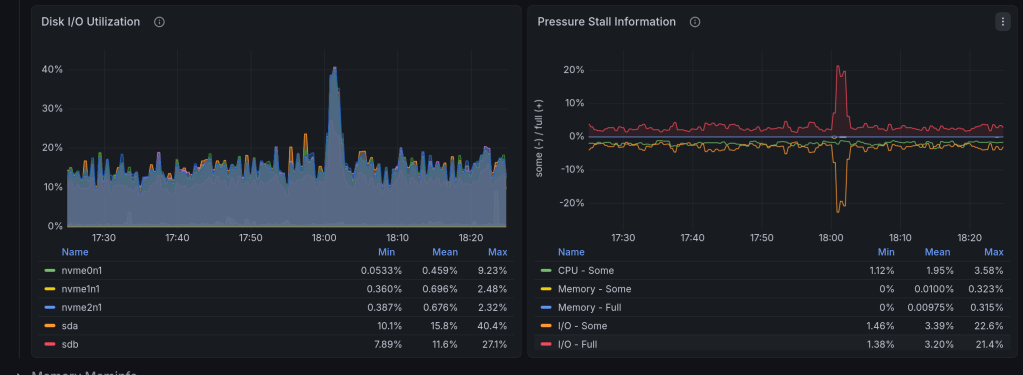
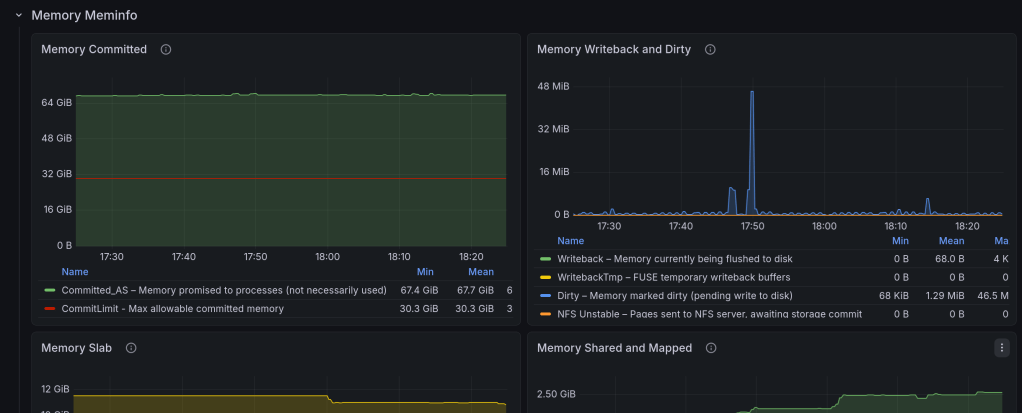
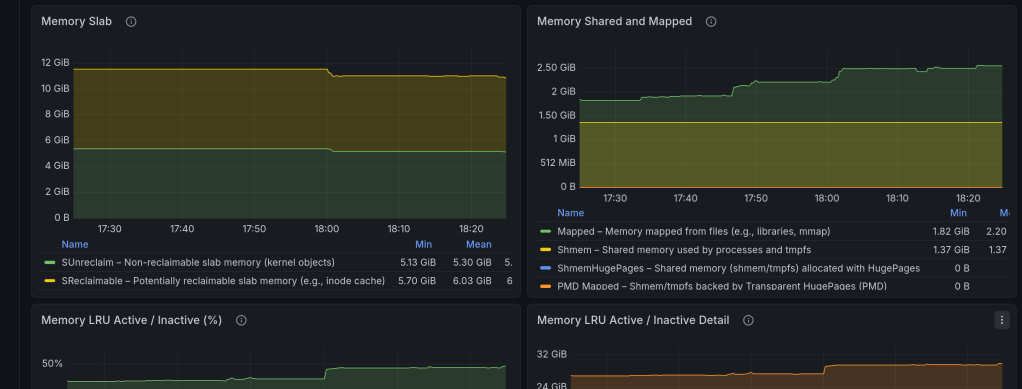
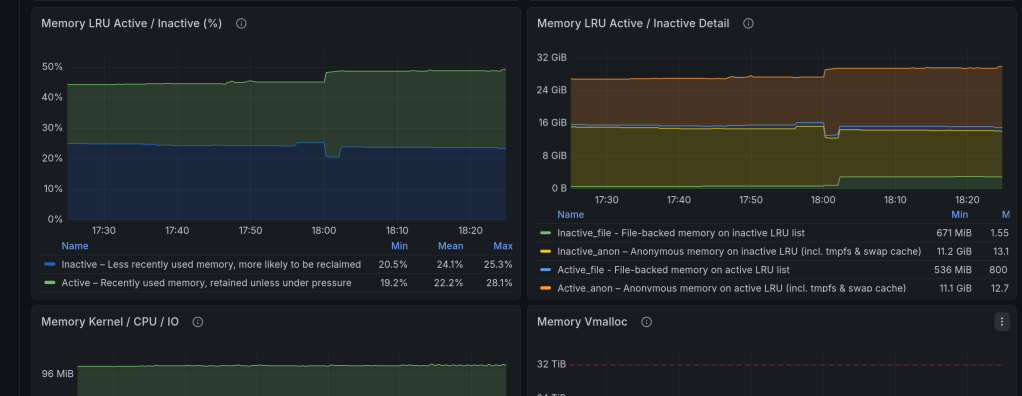
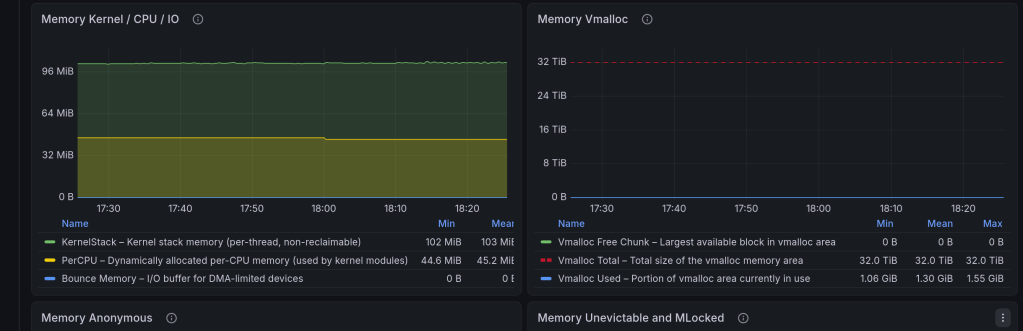
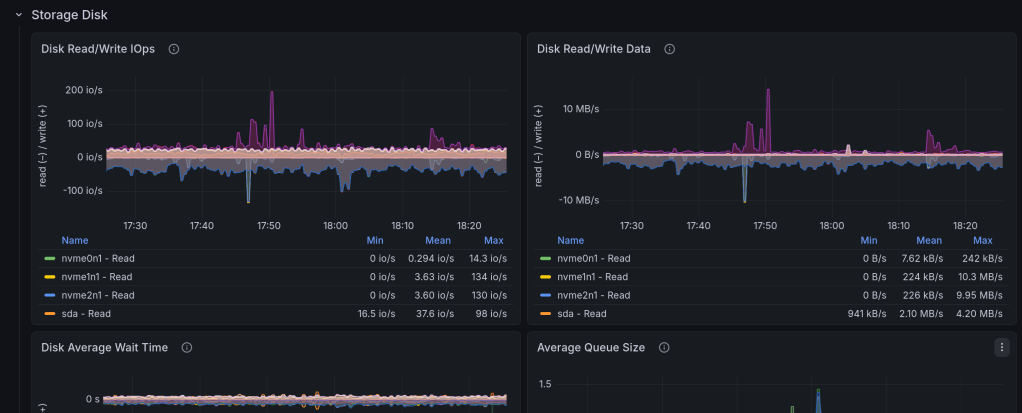
Grafana coupled with Prometheus as a docker container that provides CPU, RAM, network bandwidth metrics and much more.
Over 1 billion downloads in DockerHub!!

Grafana coupled with Prometheus as a docker container that provides CPU, RAM, network bandwidth metrics and much more.
Over 1 billion downloads in DockerHub!!
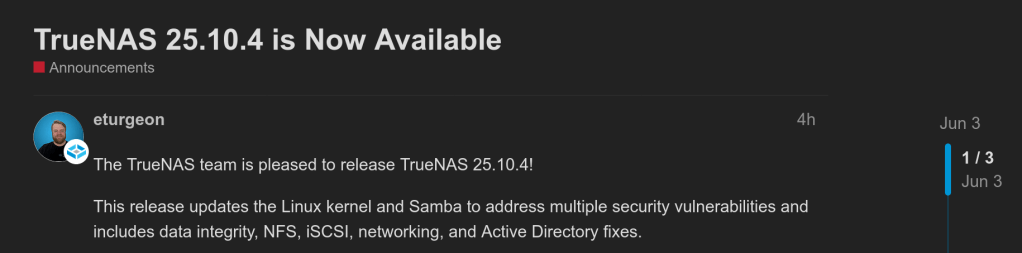
Notable changes:
getpwnam or getgrnam) generated a warning for every failed lookup, which could rapidly fill the winbind log. These messages are now logged at informational level instead of as warnings.https://www.truenas.com/docs/scale/25.10/gettingstarted/versionnotes/#25.10.4
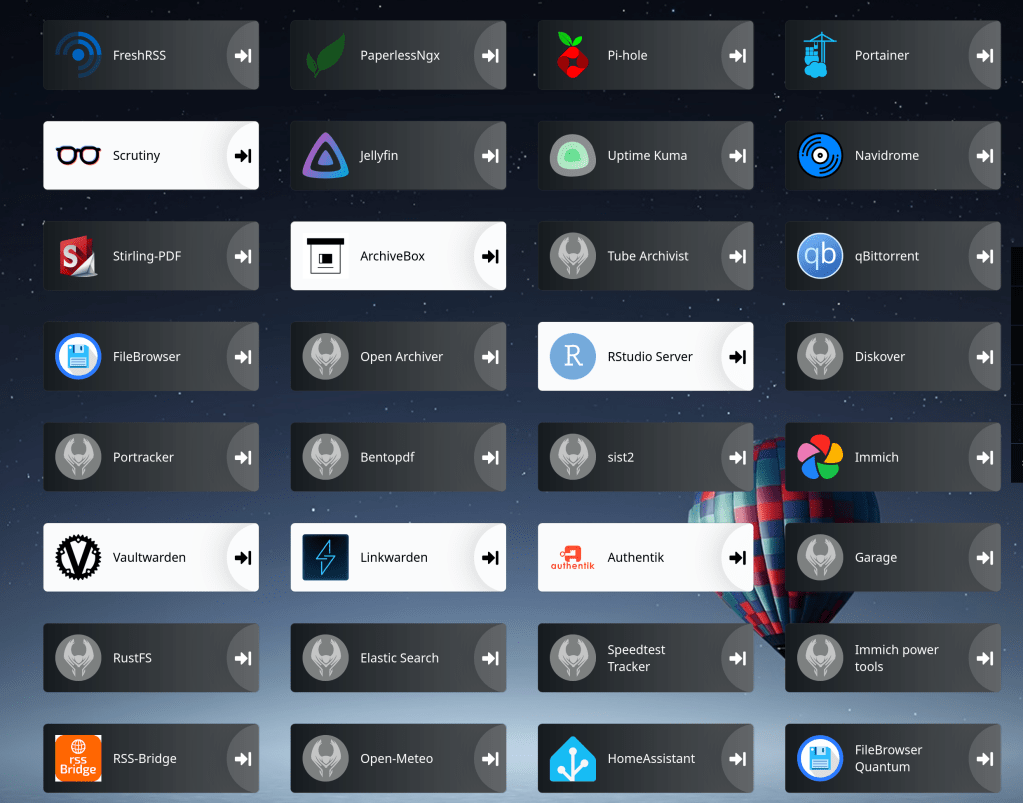
The server runs TrueNAS SCALE (release 26.0.0-BETA.1) on an AMD Ryzen 7 PRO 8845HS, with 32 GiB of memory and no swap configured. Alongside ZFS it hosts a substantial collection of services including Portainer-managed containers, immich, Forgejo, FreshRSS, Jellyfin an automation platform, several PostgreSQL databases, an identity provider, and a number of smaller tools. At the moment of measurement, the operating system reported the following:
            total   used   free   buff/cache   available
Mem: 30Gi 27Gi 1.2Gi 3.8Gi 3.3GiThe following figures come from /proc/spl/kstat/zfs/arcstats, accumulated over an uptime of 53 days:
| Metric | Value |
|---|---|
| ARC size | 5.04 GiB |
| ARC target (c) | 5.09 GiB |
| Maximum (c_max) | 29.68 GiB |
| Minimum (c_min) | 0.96 GiB |
| L2ARC | none configured |
The hit and miss rates, derived from the raw counters, break down as follows:
| Access class | Hit rate | Miss rate |
|---|---|---|
| Overall | 96.4% | 3.6% |
| Demand data | 98.05% | 1.95% |
| Demand metadata | 97.91% | 2.09% |
| Prefetch data | 6.0% | 94.0% |
| Prefetch metadata | 66.9% | 33.1% |
Because the counters above are cumulative since boot, they represent an average spanning nearly two months and cannot, on their own, describe the system’s present behaviour. To capture that, I sampled the cache once per second under active load using arcstat:
    time  read  ddread  ddh%  dmread  dmh%  pread  ph%   size      c  avail
22:23:43   949     867  98.8      77  98.7      5    0   5.3G   5.3G   118M
22:23:44   668     384  97.7     284   100      0    0   5.3G   5.3G   425M
22:23:45  1.5K    1.1K  98.5     432   100     39  2.6   5.3G   5.3G   367M
22:23:46   686     421  98.6     248   100     17    0   5.3G   5.3G   344M
With reads peaking at roughly 1500 per second, the demand-data hit rate held steady at approximately 98% matching that of the uptime, thus confirming that the long-term average is not concealing a recent decline in performance. The cache is presently serving requests just as effectively as it has, on average, throughout its uptime.
ddh% : Demand-data hit
dmh% : Demand-metadata hit
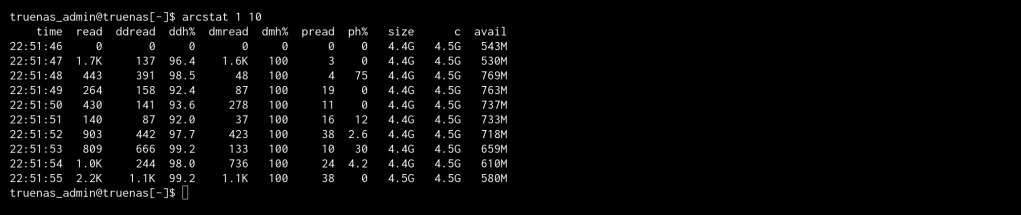
Stats were obtained from /proc/spl/kstat/zfs/arcstats, with live sampling via arcstat.
The equivalent figures are available on FreeBSD under kstat.zfs.misc.arcstats.
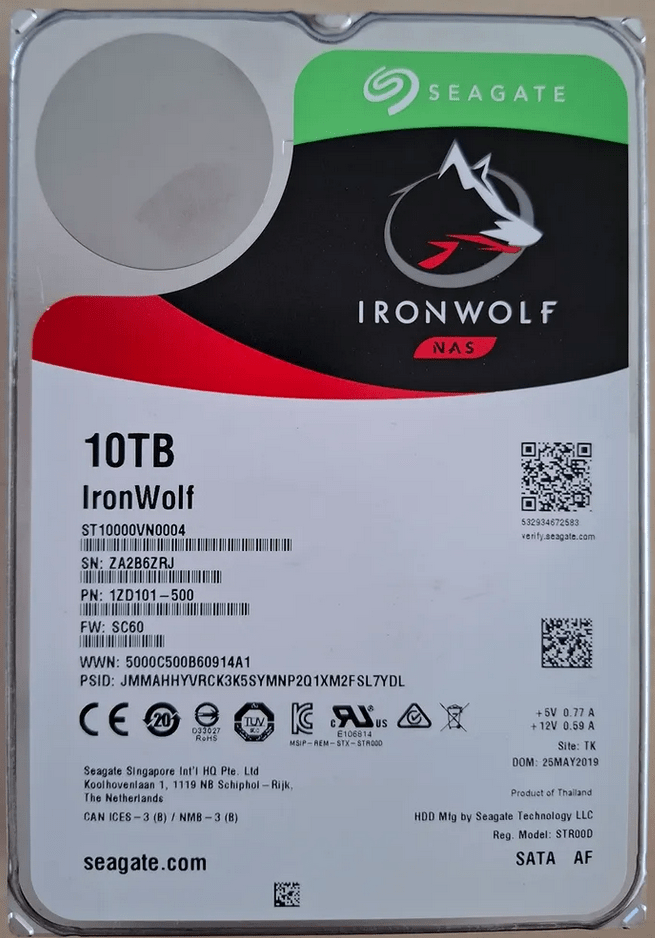
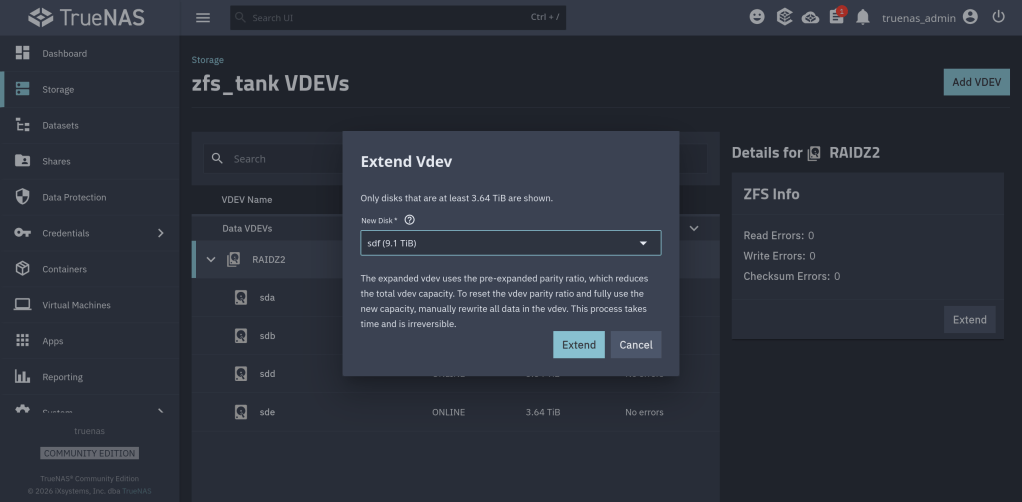
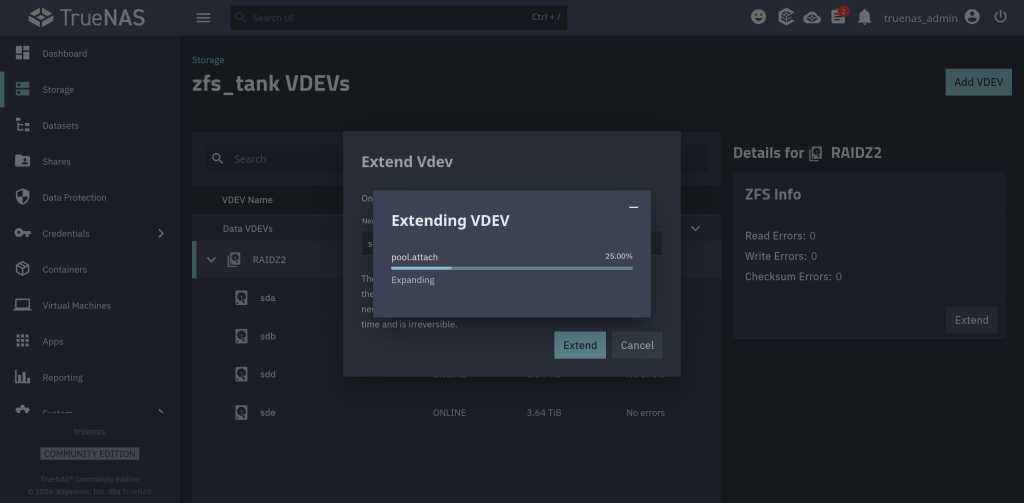
In April I expanded my main pool from four-wide RAIDZ2 to five-wide by adding a single 10 TB Seagate IronWolf to four existing 4 TB WD Red Plus drives. OpenZFS 2.3+ supports RAIDZ expansion: the new column gets added, the existing data keeps its old parity layout until rewritten, and the pool stays online throughout. The expansion completed normally.
About five weeks later, a scrub showed the following CKSUM error:
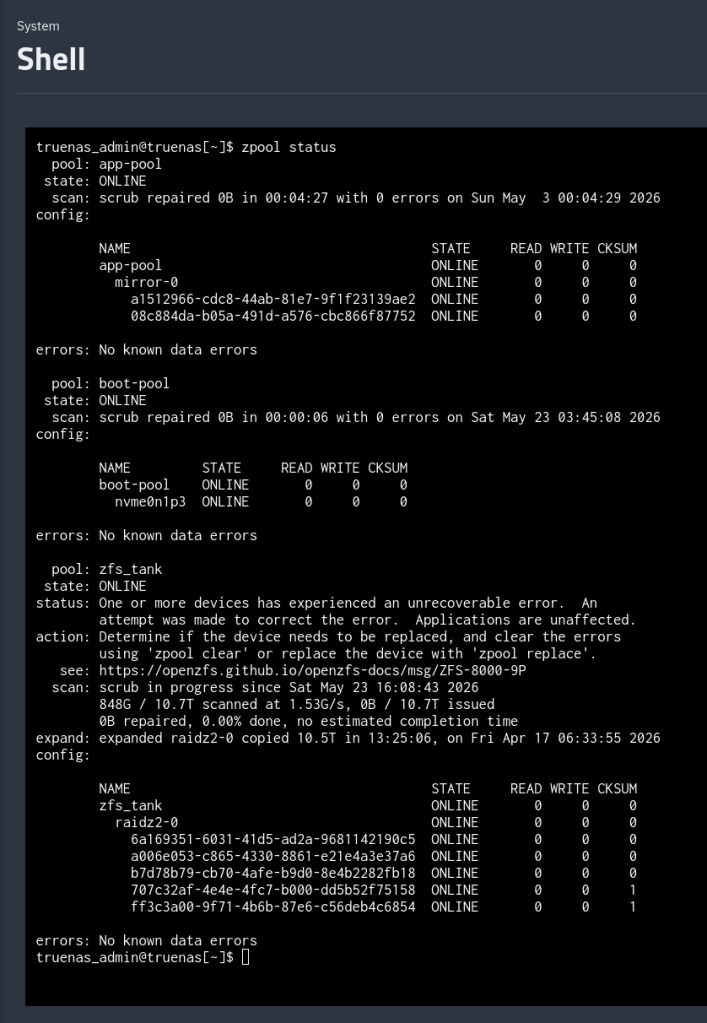
$ sudo zpool status zfs_tank pool: zfs_tank state: ONLINEstatus: One or more devices has experienced an unrecoverable error. An attempt was made to correct the error. Applications are unaffected.action: Determine if the device needs to be replaced, and clear the errors using 'zpool clear' or replace the device with 'zpool replace'.config: NAME STATE READ WRITE CKSUM zfs_tank ONLINE 0 0 0 raidz2-0 ONLINE 0 0 0 6a169351-6031-41d5-ad2a-9681142190c5 ONLINE 0 0 0 a006e053-c865-4330-8861-e21e4a3e37a6 ONLINE 0 0 0 b7d78b79-cb70-4afe-b9d0-8e4b2282fb18 ONLINE 0 0 0 707c32af-4e4e-4fc7-b000-dd5b52f75158 ONLINE 0 0 1 ff3c3a00-9f71-4b6b-87e6-c56deb4c6854 ONLINE 0 0 1errors: No known data errors
One checksum error on each of two disks. The pool itself reports zero errors: errors: No known data errors. So no data were degraded.
RAIDZ2 carries two parity columns, the scrub detected bad blocks, and ZFS reconstructed them from parity so the pool status remains healthy. But zpool status only tells you that an error happened and not if it got corrected.
So where is the healing actually recorded?
zpool status shows, and what it doesn’tThe four columns in zpool status map directly to four counters in the kernel’s vdev_stat_t structure (include/sys/vdev_impl.h):
vs_read_errorsvs_write_errorsvs_checksum_errorsSTATEzpool status parses each leaf vdev’s stats and prints those four numbers. It does not print any of the other ~30 fields in the structure — including this one:
uint64_t vs_self_healed; /* total bytes self-healed */
vs_self_healed is incremented in vdev_stat_update() whenever ZFS issues a write with the ZIO_FLAG_SELF_HEAL flag set, which happens after a successful parity reconstruction. The kernel knows exactly how many bytes were healed on each disk. It just doesn’t tell you via the standard zpool status output.
The OpenZFS Linux module exposes every leaf vdev’s full vdev_stat_t under /proc/spl/kstat/zfs/<pool>/. The filenames use the leaf vdev GUID. Pull those GUIDs out of the pool query:
$ sudo ls /proc/spl/kstat/zfs/zfs_tank/ | headiostatetxgsvdev_395717205876781294vdev_4003307236673040230vdev_7306733904703790705vdev_803393823450321549vdev_9021081546382363770
The 9021... and 4003... files are the two disks with errors. Inside:
$ sudo cat /proc/spl/kstat/zfs/zfs_tank/vdev_9021081546382363770...name type datavdev_state 3 7vdev_guid 4 9021081546382363770read_errors 4 0write_errors 4 0checksum_errors 4 1self_healed 4 4096...
self_healed 4096 — four kilobytes. The pool’s ashift is 12, so one block. Exactly one block was reconstructed and rewritten on this disk. Same value on the other affected disk.
If you’re on TrueNAS, the same field comes back as JSON from the pool.query endpoint:
{ "name": "707c32af-4e4e-4fc7-b000-dd5b52f75158", "stats": { "checksum_errors": 1, "self_healed": 4096, "read_errors": 0, "write_errors": 0 }}
This is how I first saw the number. The middleware just unpacks vdev_stat_t into JSON.
zpool events — the actual heal logCounters tell you how much. To see when and where, look at the ZFS event ring buffer:
$ sudo zpool events -v zfs_tank | grep -A 30 'ereport.fs.zfs.checksum'May 23 2026 05:42:14.823145112 ereport.fs.zfs.checksum class = "ereport.fs.zfs.checksum" ena = 0x... detector = (embedded nvlist) version = 0x0 scheme = "zfs" pool = 0x6794d4c... vdev = 0x7d24a0... (end detector) pool = "zfs_tank" pool_guid = 0x6794d4cc9d3a8916 vdev_guid = 0x7d24a0aaa18cb6ba vdev_type = "disk" vdev_path = "/dev/disk/by-partuuid/707c32af-4e4e-4fc7-b000-dd5b52f75158" zio_err = 0 zio_offset = 0x... zio_size = 0x1000 zio_objset = 0x... zio_object = 0x... zio_blkid = 0x... cksum_expected = ... cksum_actual = ...
Each event names the affected disk, the byte offset on that disk, the size (here 0x1000 = 4 KiB), the dataset and object, and both checksums. With this you can compute exactly which file (if any) the block belonged to. The buffer holds ~1000 events by default (zfs_zevent_len_max), so old events roll out unless ZED has persisted them to /var/log/zfs/zed.log.
This is the closest thing ZFS has to a “self-heal log.”
Two disks, one block each, both healed. Different manufacturers (WD Red Plus 4 TB / Seagate IronWolf 10 TB), different uptime (6124 h / 3724 h), so a shared hardware fault was unlikely. SMART on both was clean:
$ sudo smartctl -a /dev/sde | grep -E '^( 5|197|198|199) ' 5 Reallocated_Sector_Ct 0x0033 200 200 140 Pre-fail Always - 0197 Current_Pending_Sector 0x0032 200 200 000 Old_age Always - 0198 Offline_Uncorrectable 0x0030 100 253 000 Old_age Offline - 0199 UDMA_CRC_Error_Count 0x0032 200 200 000 Old_age Always - 0
Same story on the Seagate. No reallocated sectors, no pending sectors, no UDMA CRC errors.
UDMA_CRC_Error_Count is the SATA-link error counter. If a cable, backplane, or HBA channel is marginal, this is where it shows up. Both at zero rules out the data path between disk and controller.
What it doesn’t rule out is RAM. This system runs 32 GB of non-ECC DDR5. A single bit-flip in a write buffer leaves a permanently-bad block on disk that scrubs will keep detecting and healing on every pass. The block stays wrong because the heal write reads the (correct) reconstructed buffer from the same RAM that may flip again. Without ECC, you can’t fully exclude this; with non-ECC, you also can’t measure it.
zpool clear vs zpool scrubThe counters in zpool status and vs_self_healed are cumulative since the last zpool clear (or since pool creation). A scrub does not reset them.
So when I ran a scrub after the original event, the 1s in the CKSUM column did not go away — they were the same 1s from before.
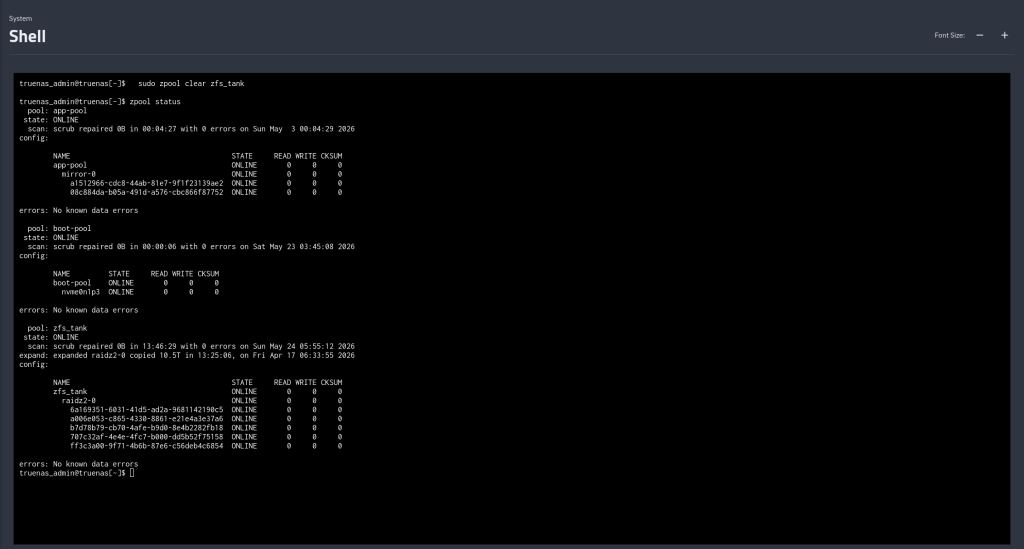
$ sudo zpool clear zfs_tank$ sudo zpool status zfs_tank pool: zfs_tank state: ONLINEconfig: NAME STATE READ WRITE CKSUM zfs_tank ONLINE 0 0 0 ...errors: No known data errors
The status line and the per-disk counters reset together. vs_self_healed resets too. After that, the next scrub starts from zero — if the same blocks show up healed again, you know the corruption is persistent on-disk (and the suspicion shifts toward RAM); if they don’t, the original event was probably a one-shot.
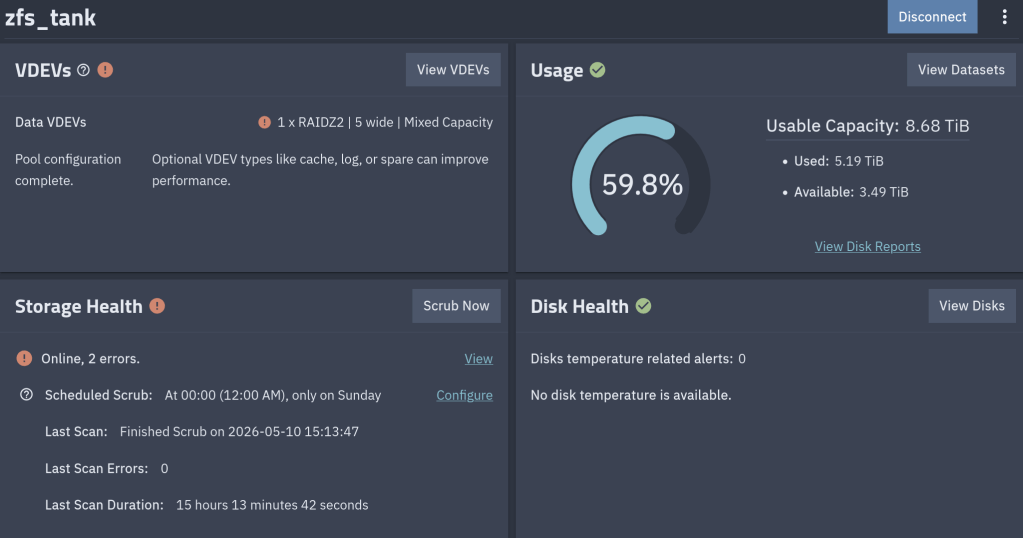
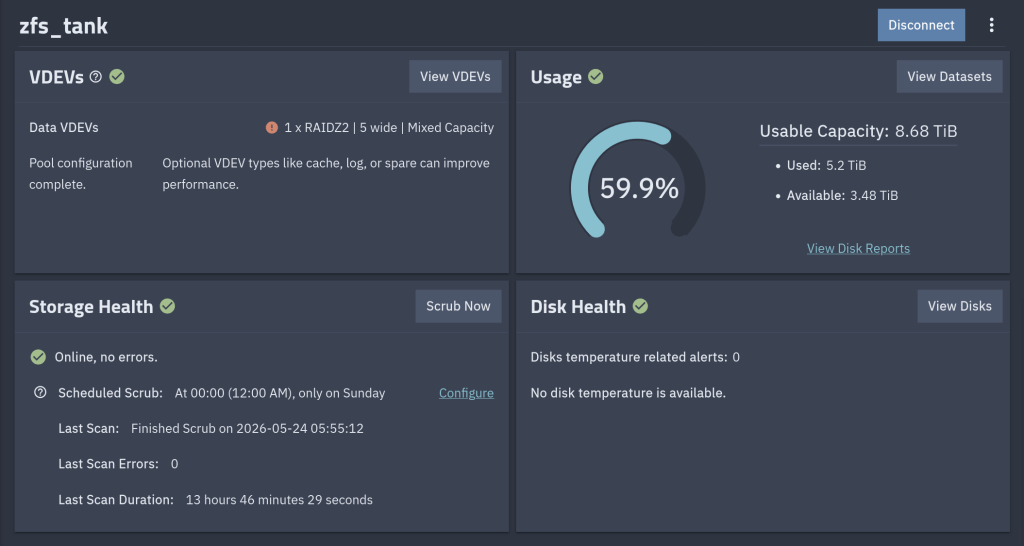
After the zpool clear
This is a guide of the steps I followed to downgrade from TrueNAS 26 MASTER to TrueNAS 26 BETA1. (specifically from 26.0.0-MASTER+20260405-020459 to 26.0.0-BETA.1)
TrueNAS considers MASTER a higher train than BETA. Attempting a manual update from MASTER to BETA.1 gives:
Unable to downgrade from 26.0.0-MASTER+20260405-020459 to 26.0.0-BETA.1
Step 1: Bypass the Downgrade Check
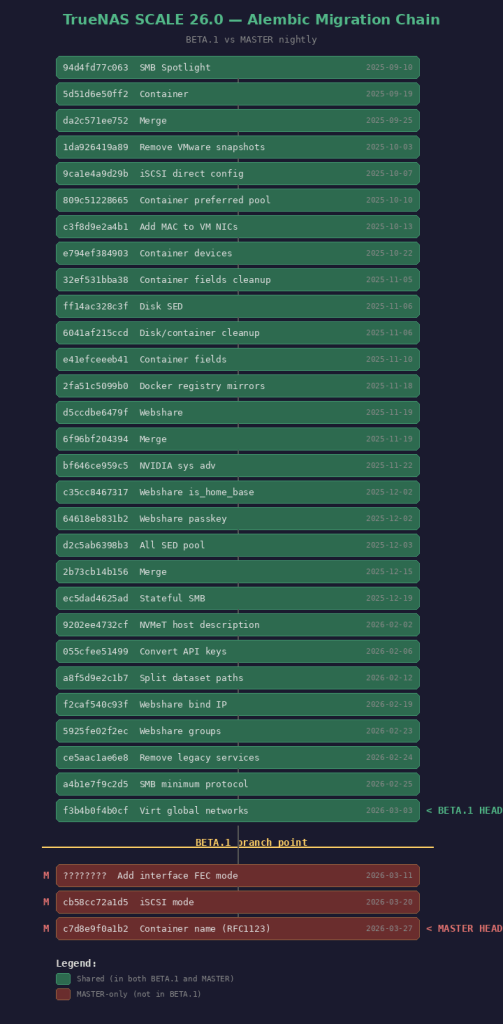
Step 2: Fix the Alembic Migration Mismatch
You need to find BETA.1’s head migration revision. Mount the .update file on another Linux machine:
sudo mkdir -p /tmp/truenas-beta
sudo mount -t squashfs -o ro,loop TrueNAS-26.0.0-BETA.1.update /tmp/truenas-beta
sudo mkdir -p /tmp/truenas-rootfs
sudo mount -t squashfs -o ro,loop /tmp/truenas-beta/rootfs.squashfs /tmp/truenas-rootfs
Find the last migration file and its revision ID:
ls /tmp/truenas-rootfs/usr/lib/python3/dist-packages/middlewared/alembic/versions/26.0/
grep “^revision” /tmp/truenas-rootfs/…/last_migration_file.py
Then on TrueNAS, stamp the database with that revision:
sudo sqlite3 /data/freenas-v1.db “UPDATE alembic_version SET version_num=”;”
Step 3: Apply the Update
DISCLAIMER: Keep a backup of your settings!!!!
Happy to contribute not only to TrueNAS but also to OpenZFS upstream !!
The official announcement from iXsystems: https://www.truenas.com/blog/blog-truenas-26-beta1-release/
https://www.phoronix.com/news/TrueNAS-26-Beta
Download the BETA iso from here: https://download.truenas.com/TrueNAS-26-BETA/26.0.0-BETA.1/TrueNAS-26.0.0-BETA.1.iso
The .update file version is available here: https://update-public.sys.truenas.net/TrueNAS-26-BETA/TrueNAS-26.0.0-BETA.1.update
TrueNAS 26 BETA1 come up next week. Also a quite interesting discussion about air-gapped backups.
Running TrueNAS in VirtualBox is a great way to test configurations, experiment with ZFS pools, or learn the TrueNAS UI before deploying on real hardware. As of February 2026, the latest stable version is TrueNAS 25.10.2.1 (Goldeye), with TrueNAS 26 beta planned for April 2026.
Under System > Processor, make sure to enable PAE/NX. Under System > Acceleration, enable VT-x/AMD-V and Nested Paging.
For the disk controller, use AHCI (not IDE) for better performance and compatibility.
Note: If you’re on an AMD system and get a VERR_SVM_IN_USE error, you may need to unload the KVM modules first — see my post on VirtualBox AMD-V fix.
Once TrueNAS boots, it will display the web UI address on the console. Open it in your browser and create your ZFS pool using the additional virtual disks.
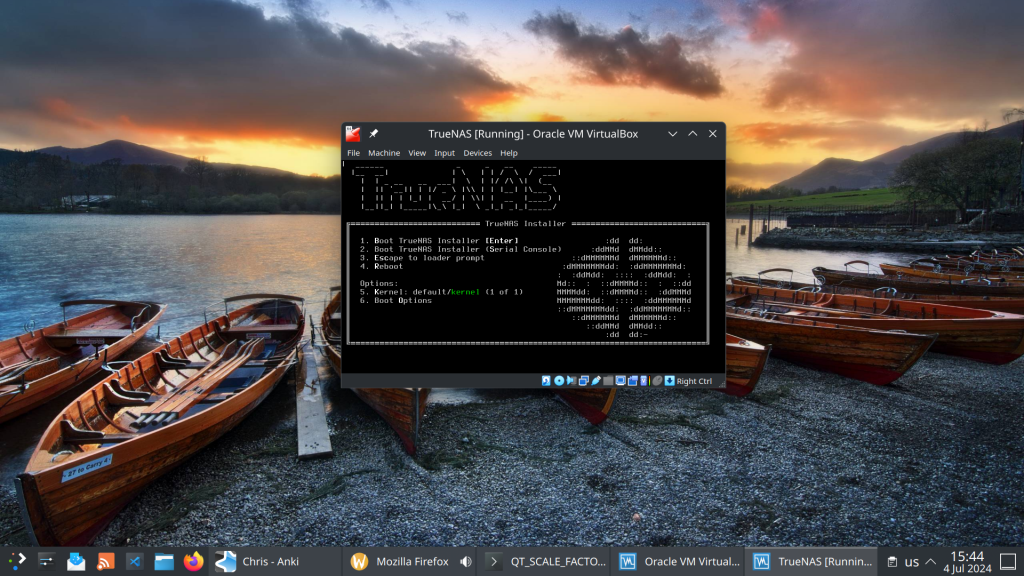
This setup is perfect for testing pool configurations, snapshots, replication, and apps before committing to production hardware.
The latest episode of TrueNAS Tech Talk (T3) — Episode 56 — dropped on March 6, 2026, and it’s packed with news that every TrueNAS homelab enthusiast and sysadmin will want to hear. Hosts Kris Moore and Chris Peredun (the TrueNAS HoneyBadger) cover the upcoming TrueNAS 26 release schedule, a deep dive into the new dataset tiering feature, and tackle eight viewer questions.
TrueNAS 26: A (Tentative!) Release Timeline
The big headline this week is that Kris and Chris finally lay out the tentative roadmap from the first TrueNAS 26 BETA release all the way through to the .0 general availability. If you’ve been waiting to know when you can get your hands on the next generation of TrueNAS software, this episode gives you the clearest picture yet. No more codenames, no more decimal versioning — as the team confirmed back in Ep. 52, TrueNAS is moving to a clean annual release cycle, and 26 is the first major fruit of that shift.
Dataset Tiering: Hybrid Storage Gets Smarter
One of the standout features coming to TrueNAS 26 is dataset tiering — the ability to mix fast flash and spinning-disk pools and automatically tier datasets (or shares) between them. This is an Enterprise-tier feature, meaning it won’t land in the Community Edition, but the architecture is fascinating for anyone interested in how ZFS and TrueNAS manage data placement at scale. Since this is implemented at the TrueNAS layer rather than directly in OpenZFS, pools remain compatible with standard OpenZFS if you ever need to migrate away, though some caveats may apply.
For those of us running pure Community Edition homelabs — Docker stacks, S3-compatible storage, and all — it’s still a great signal of the direction TrueNAS engineering is heading.
Eight Viewer Questions
As always, Kris and Chris close out the episode with a batch of community questions — likely touching on storage configuration, upgrade paths, and follow-up on ZFS AnyRaid and Spotlight search (truesearch) from recent episodes.
Why This Episode Matters for Homelab Users
If you’re self-hosting on TrueNAS Scale — running Docker containers, managing snapshots over Tailscale, or experimenting with S3-compatible backends like RustFS or Garage — TrueNAS 26 is a significant milestone. The annual cadence promises more predictable upgrade windows, and features like dataset tiering give a window into where the platform’s storage smarts are heading.
Watch the full episode on the TrueNAS blog or on YouTube.
T3 Tech Talk is a weekly podcast from the TrueNAS team. New episodes drop every Thursday.
So …