
Introducing ankiR Stats: The Only Anki Addon with Time Series Analytics
I’m excited to announce the release of ankiR Stats, a new Anki addon that brings advanced statistical analysis to your flashcard reviews. If you’ve ever wondered about the patterns hidden in your study data, this addon is for you.
Why Another Stats Addon?
There are several statistics addons for Anki already – Review Heatmap, More Overview Stats, True Retention. They’re great for basic numbers. But none of them answer questions like:
- Is my retention trending up or down over time?
- What’s my weekly study pattern? Do I study more on weekends?
- Which days were unusually productive (or lazy)?
- How are my card intervals growing over months?
ankiR Stats answers all of these using the same statistical techniques data scientists use.
Features
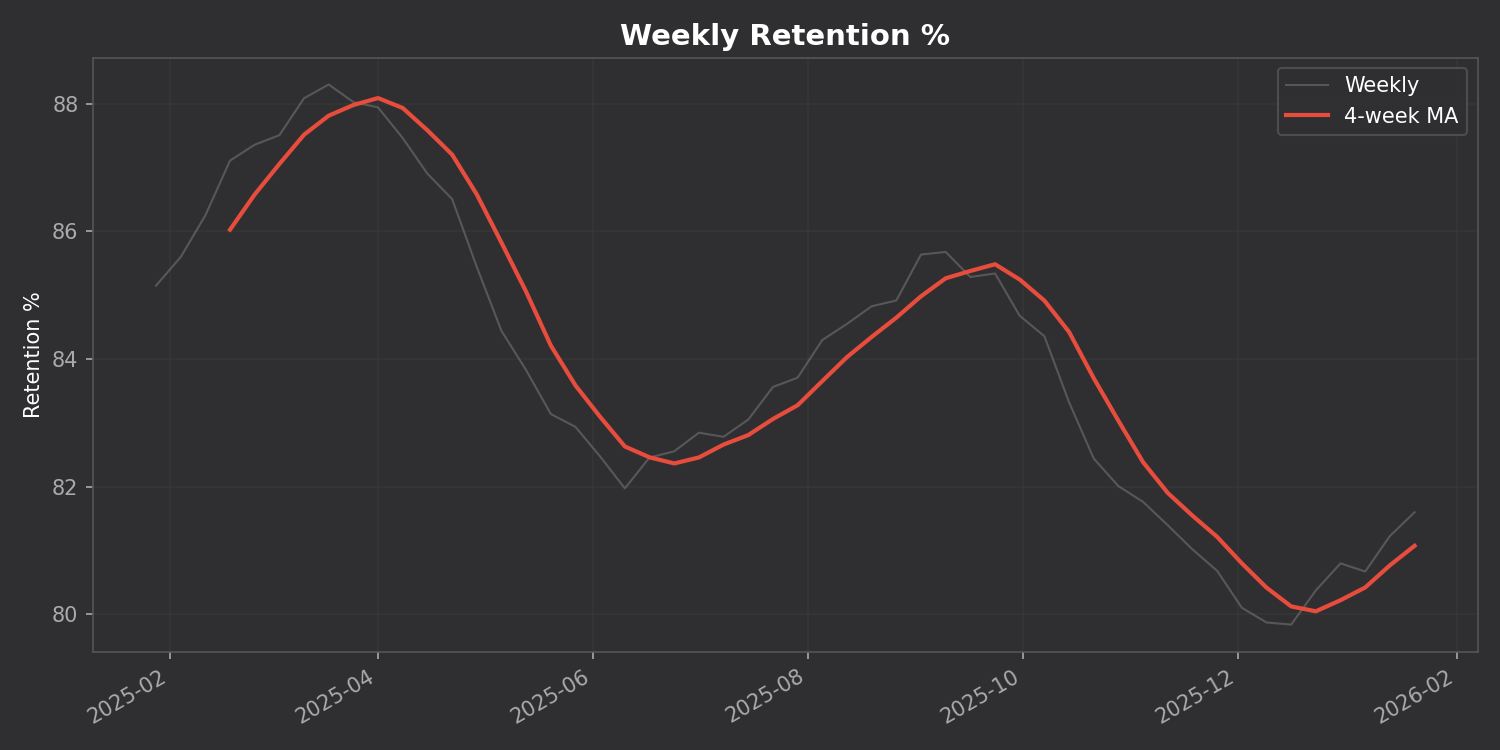
📊 Time Series Charts
Track your retention, reviews, and intervals over time with a 4-week moving average to smooth out the noise:
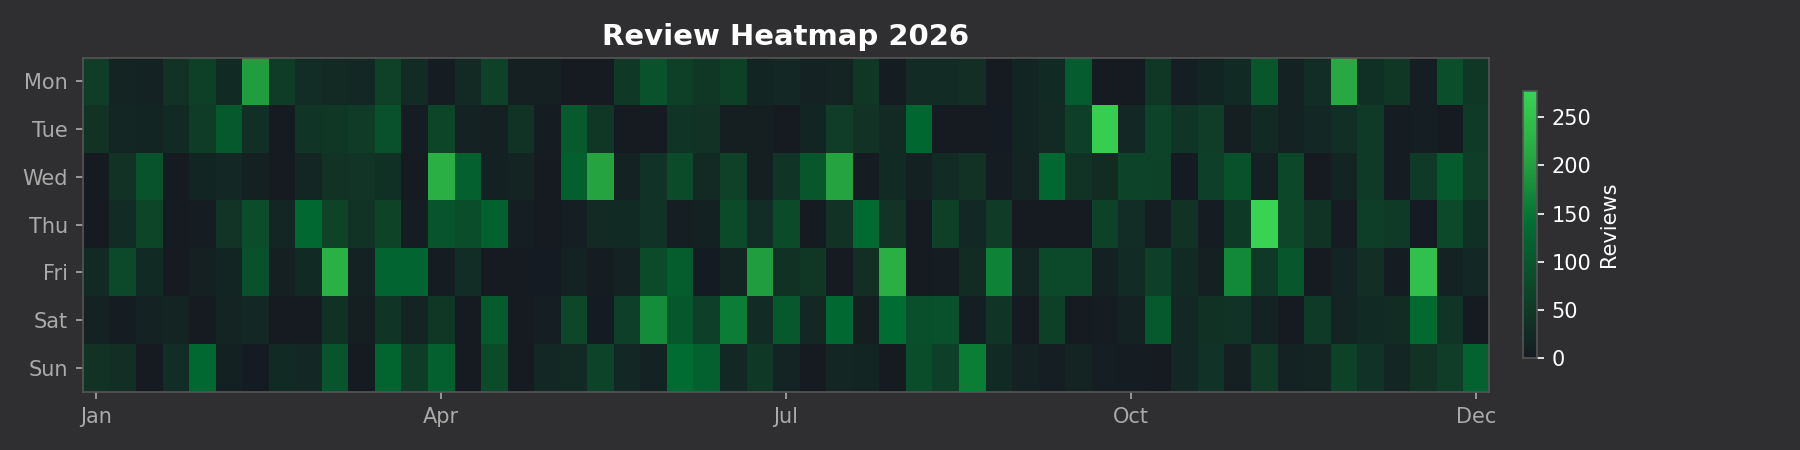
🗓️ GitHub-style Heatmap
See your entire year of reviews at a glance:
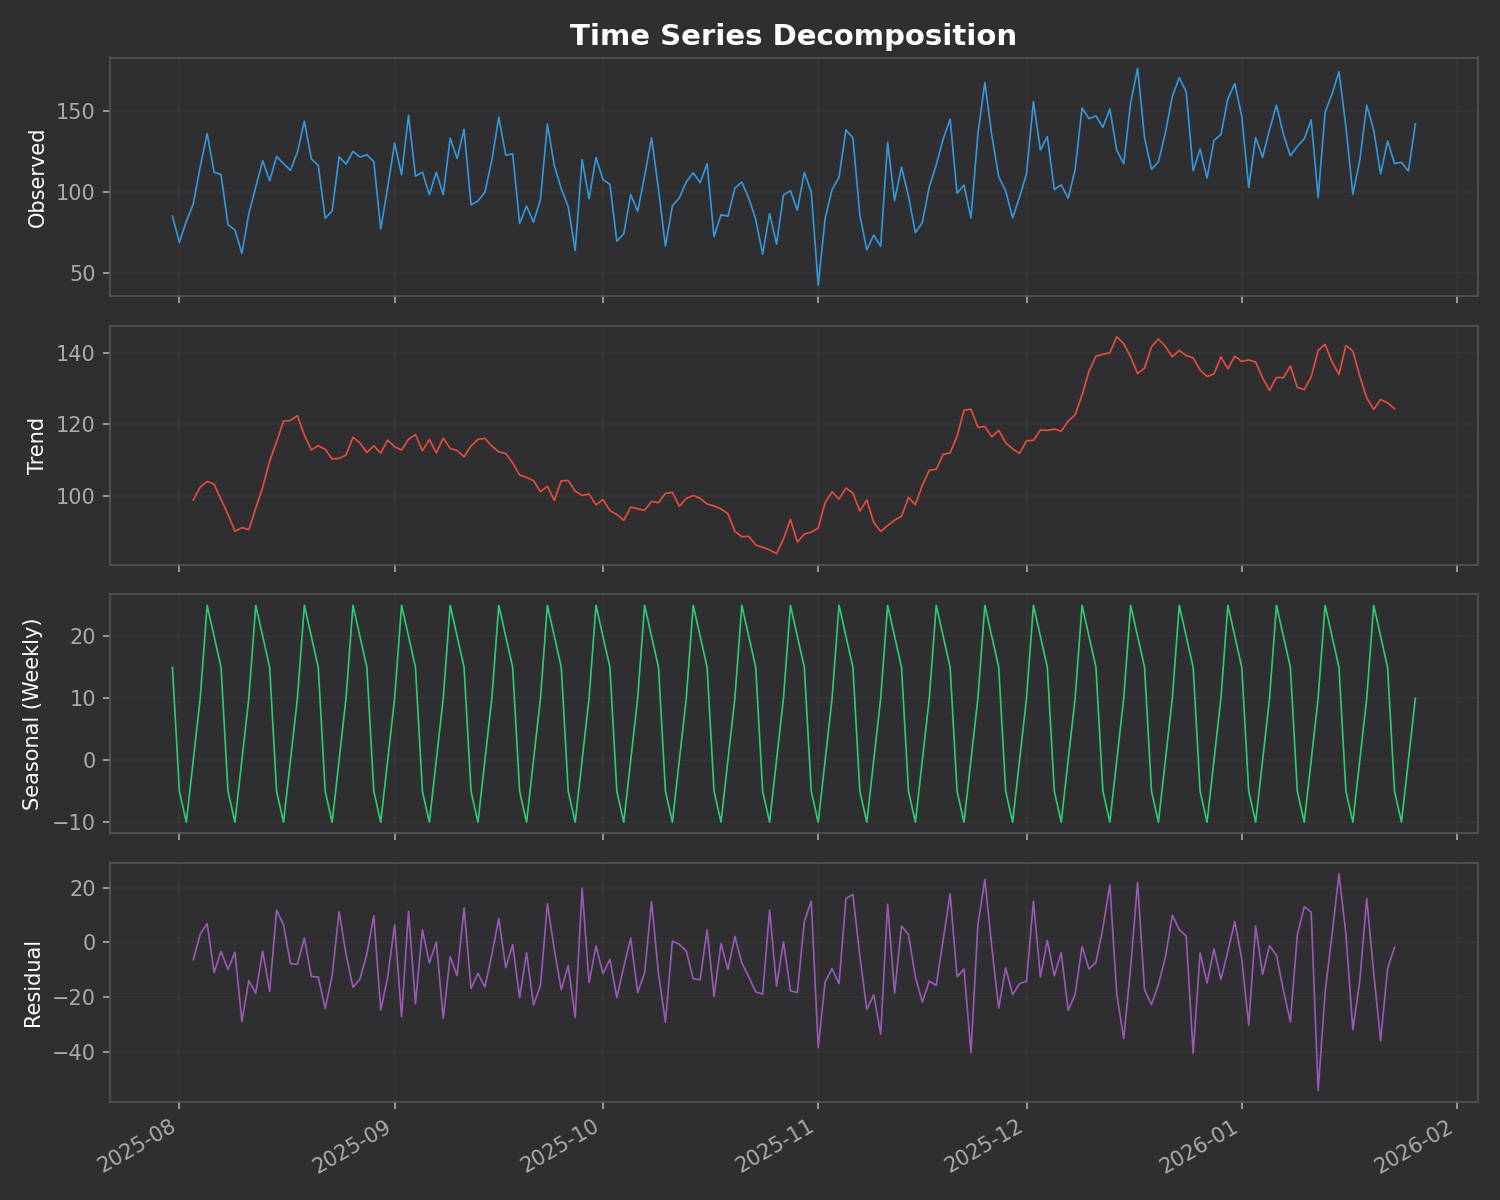
🔬 Time Series Decomposition
This is the killer feature. The addon breaks down your daily reviews into three components:
- Trend – Are you studying more or less over time?
- Seasonal – Your weekly pattern (which days you study most)
- Residual – Random variation that doesn’t fit the pattern
⚠️ Anomaly Detection
The addon automatically finds unusual study days using z-score analysis. Days where you studied way more (or less) than normal are flagged with their statistical significance.
No Dependencies
Unlike many addons that require you to install Python packages, ankiR Stats uses web-based charts (Chart.js). It works out of the box on Windows, Mac, and Linux.
Installation
- Open Anki
- Go to Tools → Add-ons → Get Add-ons
- Enter code:
419954163 - Restart Anki
- Access via Tools → ankiR Stats
Based on ankiR
This addon is a Python port of key features from ankiR, an R package I developed for comprehensive Anki analytics. The R package has 91 functions including forecasting, autocorrelation analysis, and FSRS integration – if you want even deeper analysis, check it out.
Open Source
The addon is open source and available on GitHub. Issues and contributions welcome!
Links
Let me know what you think in the comments!
