




This workflow automates the detection of OpenZFS CI failure detection via Gotify notifications !!
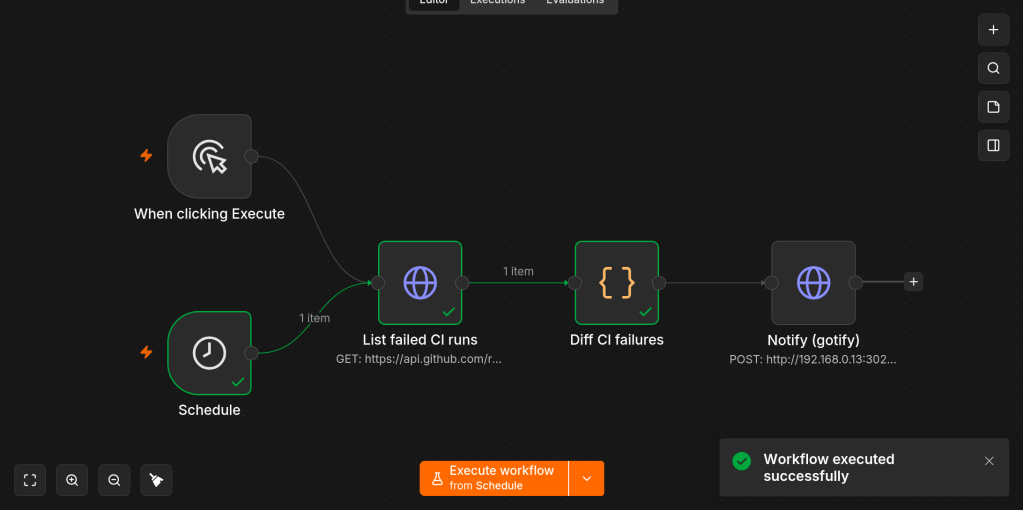
This workflow automates the detection of OpenZFS CI failure detection via Gotify notifications !!
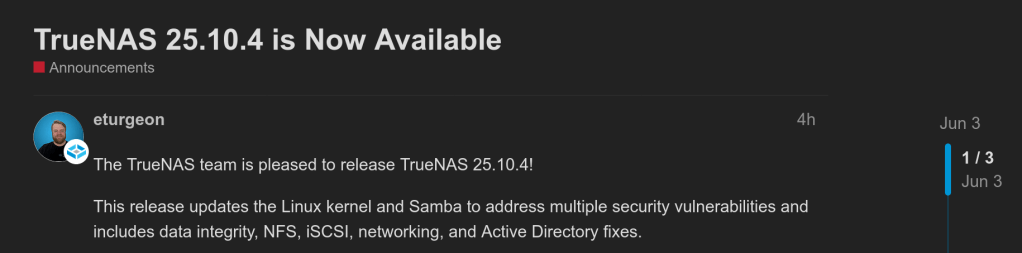
Notable changes:
getpwnam or getgrnam) generated a warning for every failed lookup, which could rapidly fill the winbind log. These messages are now logged at informational level instead of as warnings.https://www.truenas.com/docs/scale/25.10/gettingstarted/versionnotes/#25.10.4
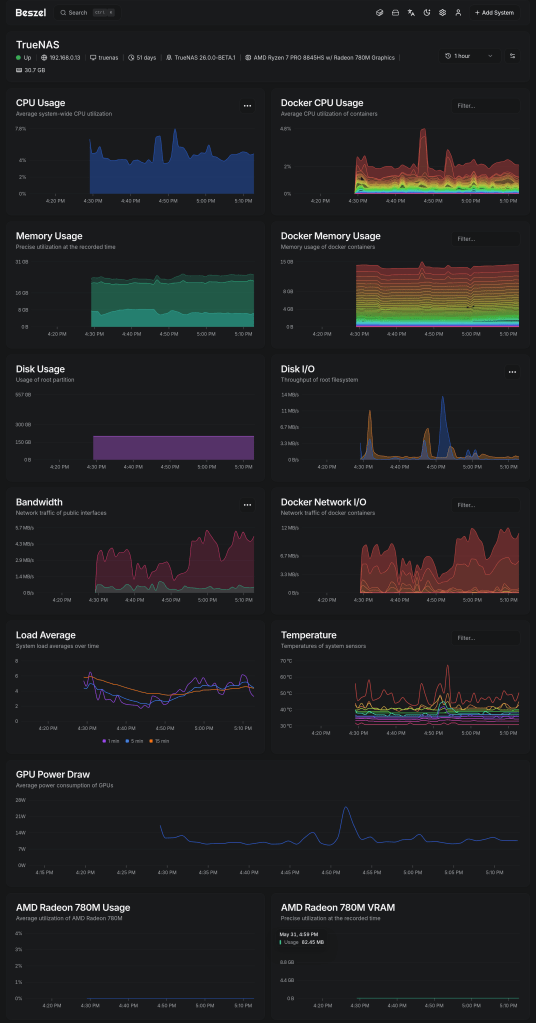
The server runs TrueNAS SCALE (release 26.0.0-BETA.1) on an AMD Ryzen 7 PRO 8845HS, with 32 GiB of memory and no swap configured. Alongside ZFS it hosts a substantial collection of services including Portainer-managed containers, immich, Forgejo, FreshRSS, Jellyfin an automation platform, several PostgreSQL databases, an identity provider, and a number of smaller tools. At the moment of measurement, the operating system reported the following:
            total   used   free   buff/cache   available
Mem: 30Gi 27Gi 1.2Gi 3.8Gi 3.3GiThe following figures come from /proc/spl/kstat/zfs/arcstats, accumulated over an uptime of 53 days:
| Metric | Value |
|---|---|
| ARC size | 5.04 GiB |
| ARC target (c) | 5.09 GiB |
| Maximum (c_max) | 29.68 GiB |
| Minimum (c_min) | 0.96 GiB |
| L2ARC | none configured |
The hit and miss rates, derived from the raw counters, break down as follows:
| Access class | Hit rate | Miss rate |
|---|---|---|
| Overall | 96.4% | 3.6% |
| Demand data | 98.05% | 1.95% |
| Demand metadata | 97.91% | 2.09% |
| Prefetch data | 6.0% | 94.0% |
| Prefetch metadata | 66.9% | 33.1% |
Because the counters above are cumulative since boot, they represent an average spanning nearly two months and cannot, on their own, describe the system’s present behaviour. To capture that, I sampled the cache once per second under active load using arcstat:
    time  read  ddread  ddh%  dmread  dmh%  pread  ph%   size      c  avail
22:23:43   949     867  98.8      77  98.7      5    0   5.3G   5.3G   118M
22:23:44   668     384  97.7     284   100      0    0   5.3G   5.3G   425M
22:23:45  1.5K    1.1K  98.5     432   100     39  2.6   5.3G   5.3G   367M
22:23:46   686     421  98.6     248   100     17    0   5.3G   5.3G   344M
With reads peaking at roughly 1500 per second, the demand-data hit rate held steady at approximately 98% matching that of the uptime, thus confirming that the long-term average is not concealing a recent decline in performance. The cache is presently serving requests just as effectively as it has, on average, throughout its uptime.
ddh% : Demand-data hit
dmh% : Demand-metadata hit
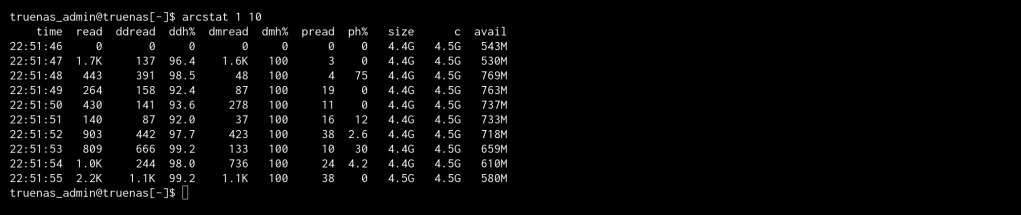
Stats were obtained from /proc/spl/kstat/zfs/arcstats, with live sampling via arcstat.
The equivalent figures are available on FreeBSD under kstat.zfs.misc.arcstats.
RAM prices are getting high, so I set up a self-hosted price tracking service called PriceBuddy to monitor specific products on Amazon.de, Amazon.com, and Geizhals.
I also built a SeleniumBase scraper to parse data from the Geizhals website.
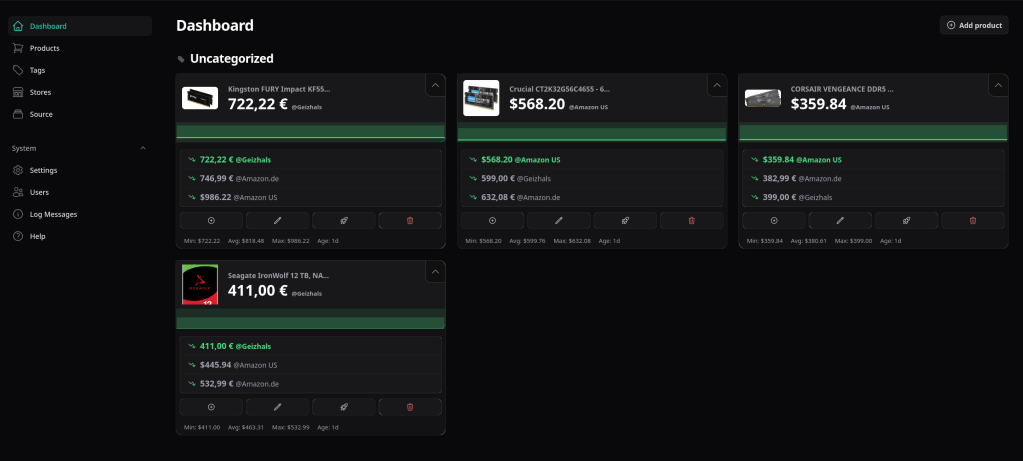
Happy testing fellow geeks.
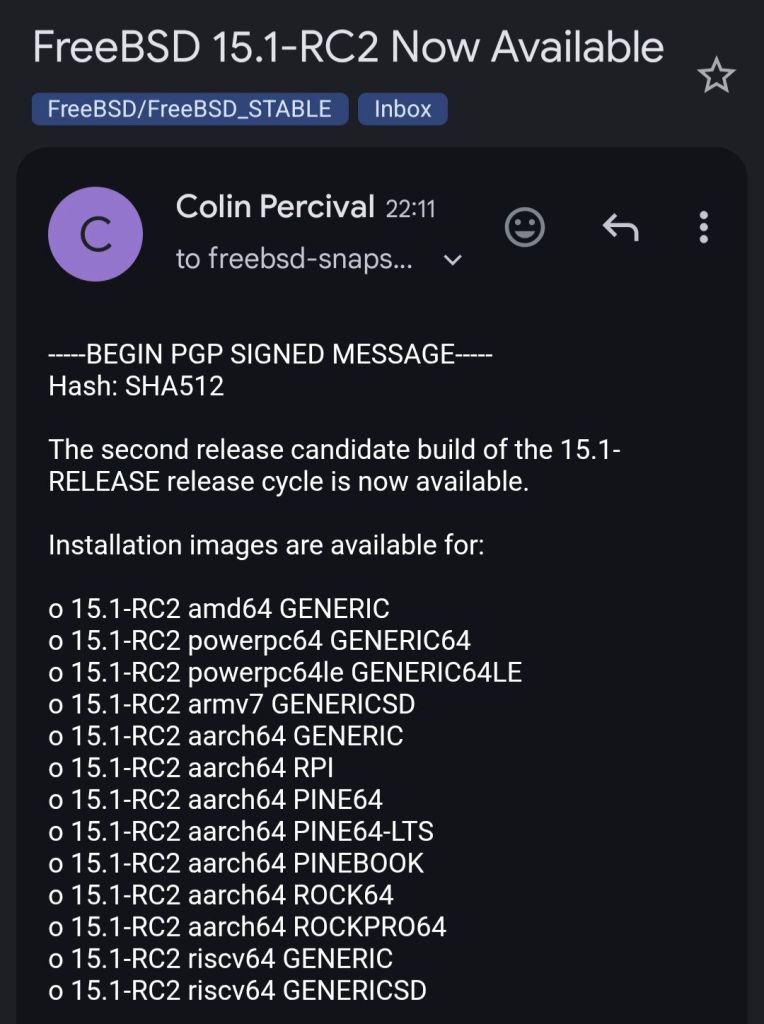
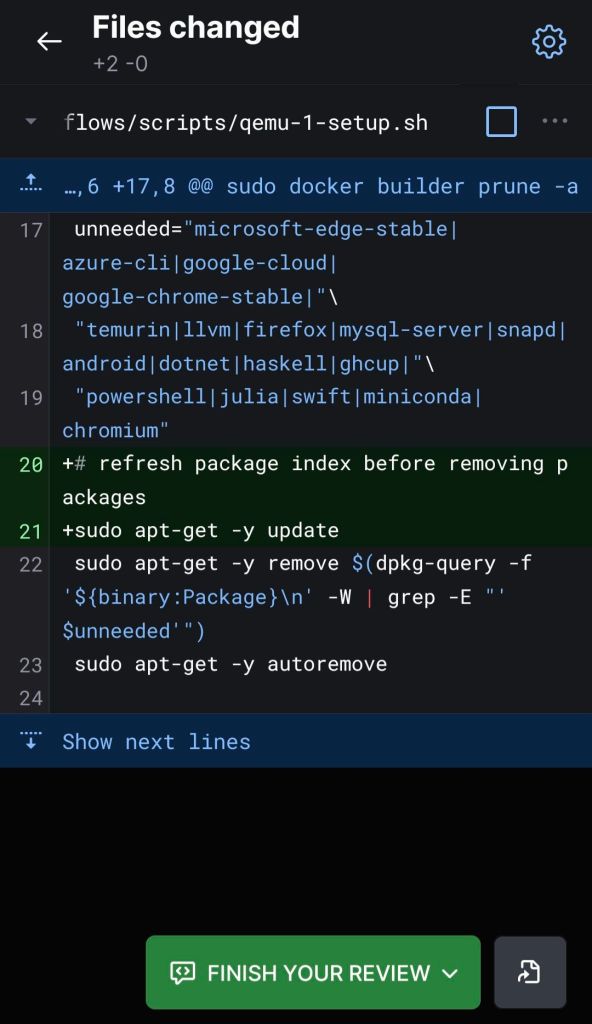
One line of code can change a bunch of failed CI matrix runs!!
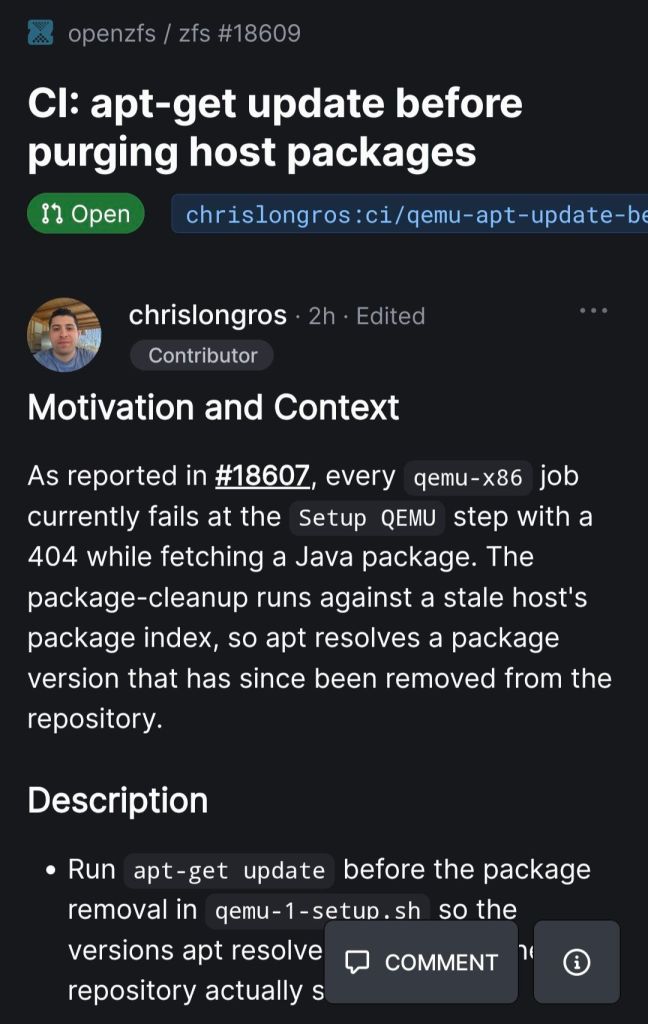
For roughly a year, my phone, laptop and desktop relied on the Tailscale-Mullvad integration to route traffic through Mullvad’s VPN. The add-on cost 5 dollars a month.
That configuration ended when my credit card got rejected and cancelled twice. So I moved to paying Mullvad directly by SEPA for 12 months.
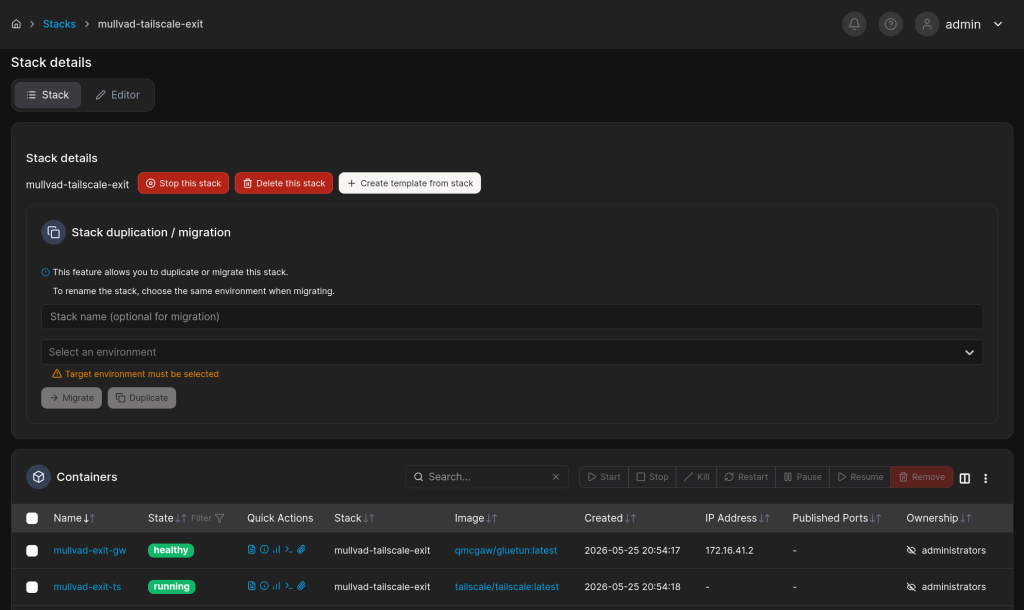
I replaced the add-on with a self-hosted equivalent on my TrueNAS server. The stack consists of two containers managed through Portainer:
Fixing a DNS leak
The initial deployment passed Mullvad’s IP check but failed its DNS check, with the result reporting Cloudflare resolvers in the city I chose. The cause lies in gluetun’s default behavior: it operates its own DNS-over-TLS resolver, and that resolver uses Cloudflare upstream unless directed otherwise. The VPN tunnel was correctly configured, but the resolver running above it bypassed Mullvad entirely. Two environment variables on the gluetun container correct this:
DOT: “off”
DNS_ADDRESS: “194.242.2.4”
The address 194.242.2.4 is Mullvad’s anycast resolver with content filtering for ads, trackers, and malware domains. I also configured the same resolver as the tailnet’s global nameserver in the Tailscale admin console, ensuring that any device routed through mullvad-de performs DNS lookups through Mullvad rather than its local resolver.