
My home server configuration:
The server runs TrueNAS SCALE (release 26.0.0-BETA.1) on an AMD Ryzen 7 PRO 8845HS, with 32 GiB of memory and no swap configured. Alongside ZFS it hosts a substantial collection of services including Portainer-managed containers, immich, Forgejo, FreshRSS, Jellyfin an automation platform, several PostgreSQL databases, an identity provider, and a number of smaller tools. At the moment of measurement, the operating system reported the following:
            total   used   free   buff/cache   available
Mem:         30Gi   27Gi   1.2Gi      3.8Gi        3.3Gi
Uptime stats:
The following figures come from /proc/spl/kstat/zfs/arcstats, accumulated over an uptime of 53 days:
| Metric | Value |
|---|---|
| ARC size | 5.04 GiB |
| ARC target (c) | 5.09 GiB |
| Maximum (c_max) | 29.68 GiB |
| Minimum (c_min) | 0.96 GiB |
| L2ARC | none configured |
The hit and miss rates, derived from the raw counters, break down as follows:
| Access class | Hit rate | Miss rate |
|---|---|---|
| Overall | 96.4% | 3.6% |
| Demand data | 98.05% | 1.95% |
| Demand metadata | 97.91% | 2.09% |
| Prefetch data | 6.0% | 94.0% |
| Prefetch metadata | 66.9% | 33.1% |
Live view of hit/miss performance:
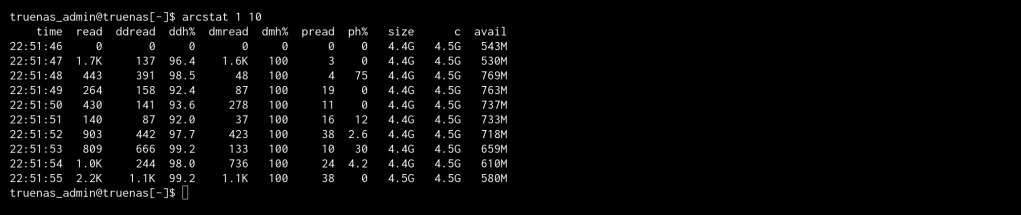
Because the counters above are cumulative since boot, they represent an average spanning nearly two months and cannot, on their own, describe the system’s present behaviour. To capture that, I sampled the cache once per second under active load using arcstat:
    time  read  ddread  ddh%  dmread  dmh%  pread  ph%   size      c  avail
22:23:43   949     867  98.8      77  98.7      5    0   5.3G   5.3G   118M
22:23:44   668     384  97.7     284   100      0    0   5.3G   5.3G   425M
22:23:45  1.5K    1.1K  98.5     432   100     39  2.6   5.3G   5.3G   367M
22:23:46   686     421  98.6     248   100     17    0   5.3G   5.3G   344M
With reads peaking at roughly 1500 per second, the demand-data hit rate held steady at approximately 98% matching that of the uptime, thus confirming that the long-term average is not concealing a recent decline in performance. The cache is presently serving requests just as effectively as it has, on average, throughout its uptime.
ddh% : Demand-data hit
dmh% : Demand-metadata hit
Stats were obtained from /proc/spl/kstat/zfs/arcstats, with live sampling via arcstat.
The equivalent figures are available on FreeBSD under kstat.zfs.misc.arcstats.
